Neal (2012) Subgrid Model Validation
HydroPol2D represents channels narrower than a model cell with the rectangular channel formulation of Neal et al. (2012). The channel and surrounding floodplain exchange water within each coarse cell. Their discharges are computed separately and combined at the cell faces.
The validation compares three local-inertial simulations:
- a fine grid that resolves the channel and floodplain explicitly;
- an ordinary coarse grid without embedded channel geometry;
- a coarse grid with the Neal (2012) channel-subgrid formulation.
The fine-grid simulation is a numerical reference. It is used to determine whether the subgrid representation preserves the hydraulic response lost during grid coarsening.
Simple in-bank channel
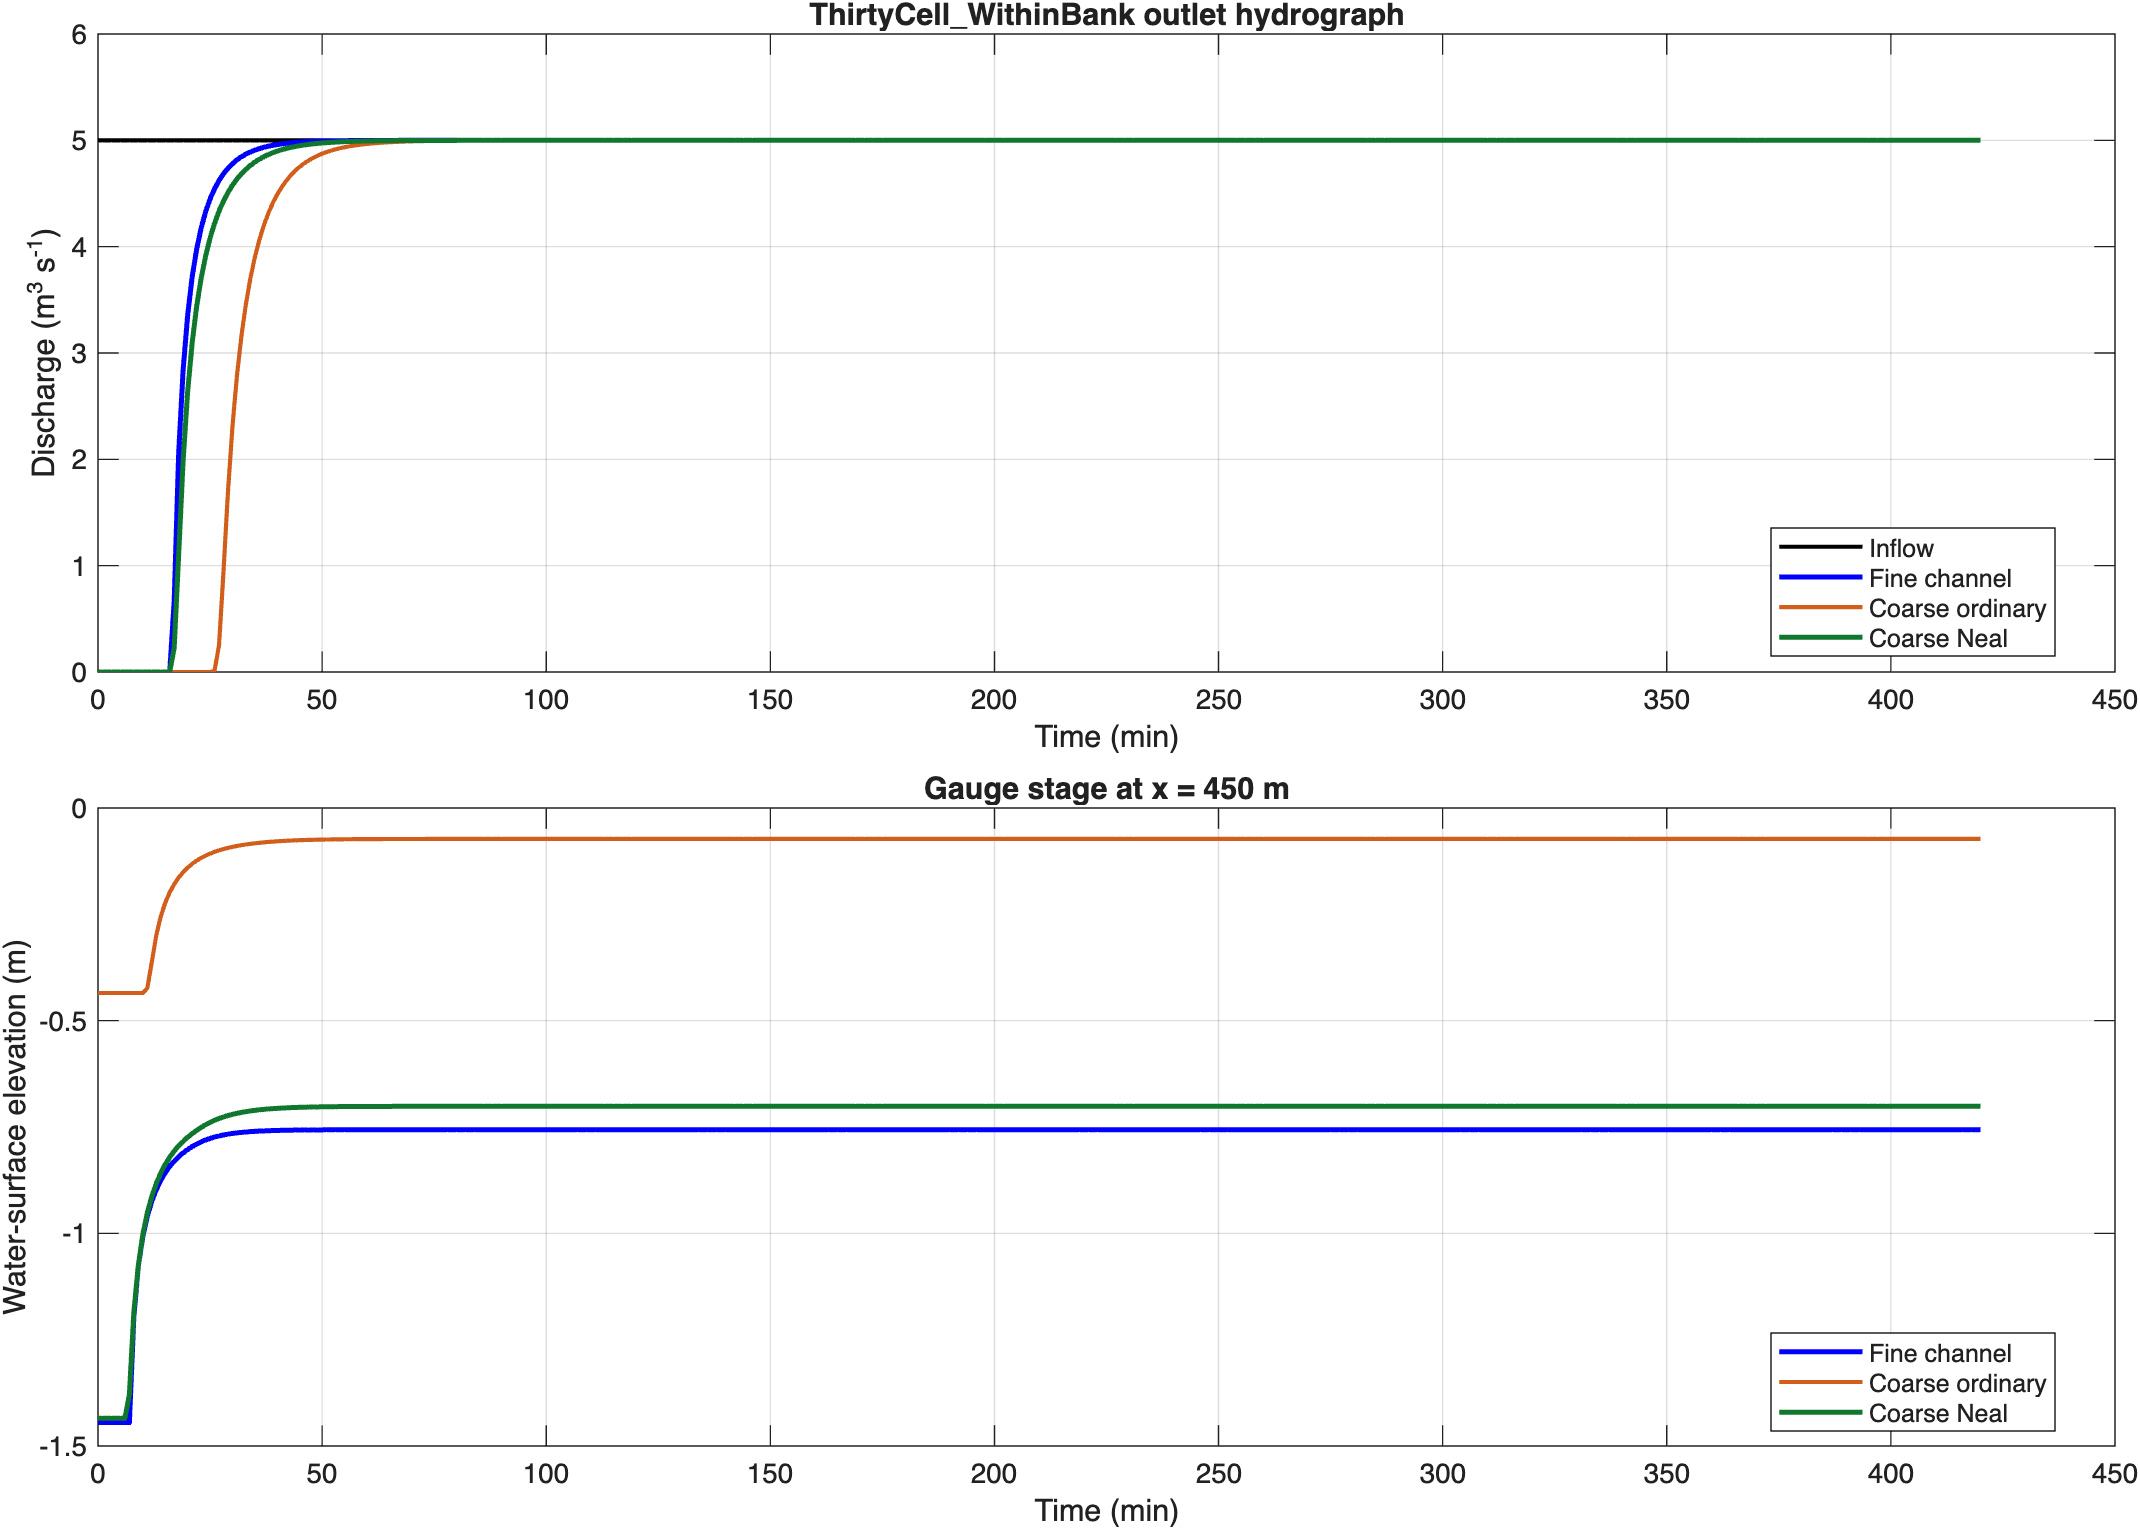
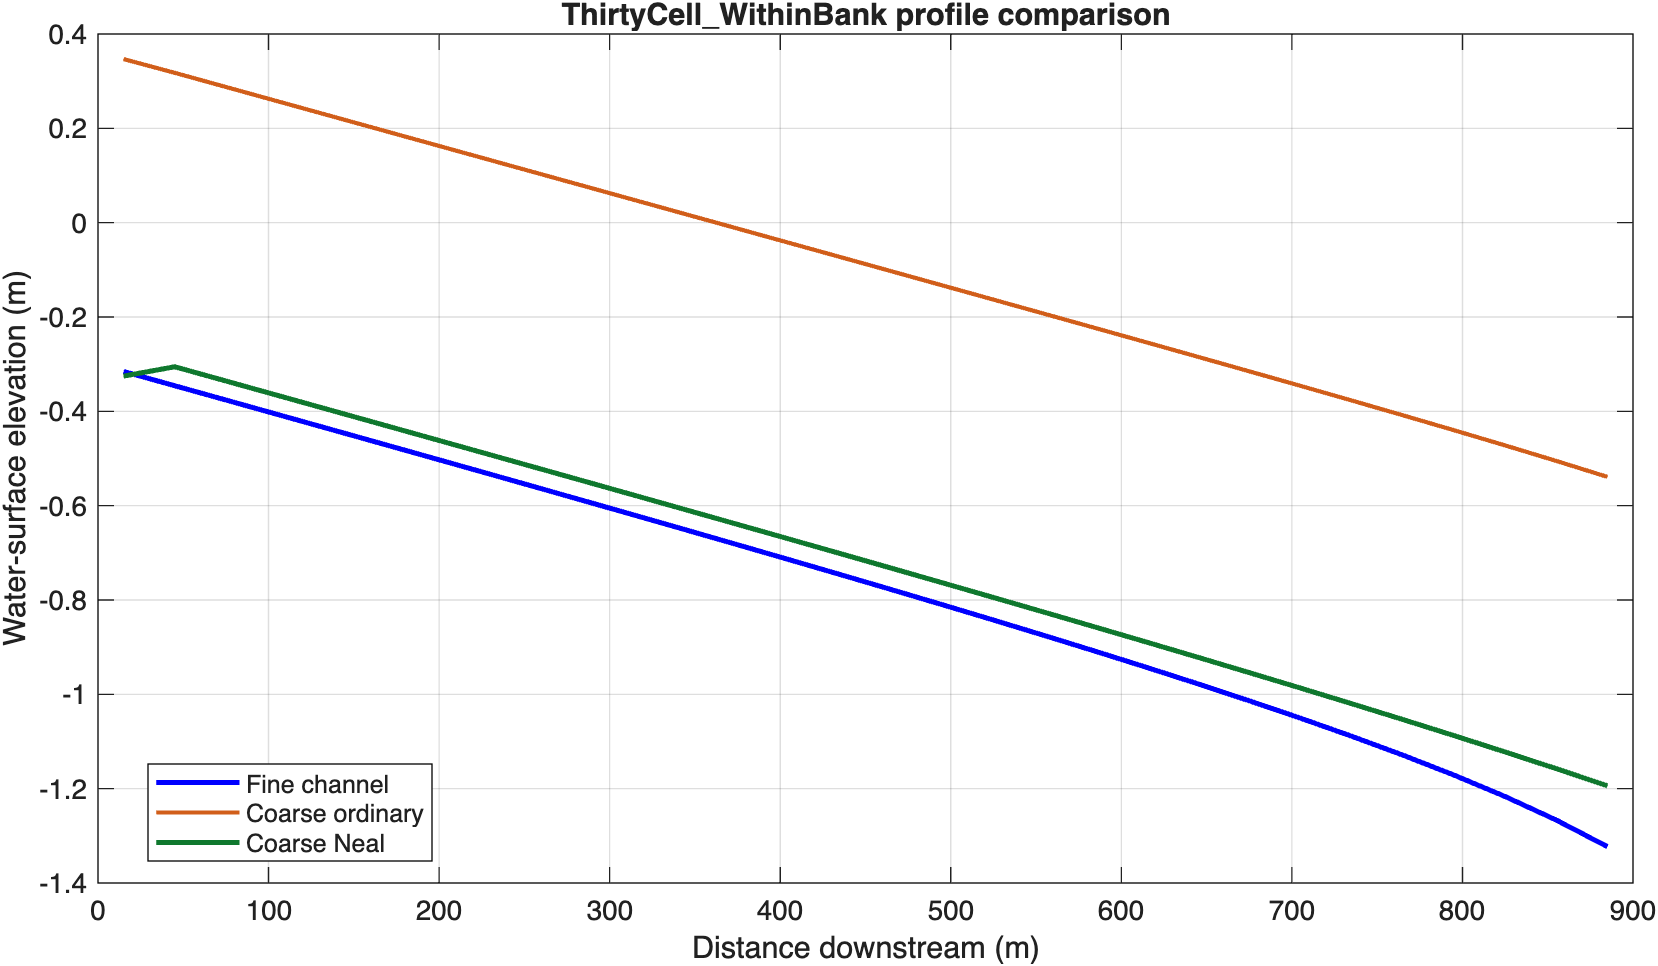
The first case isolates flow inside a channel that is narrower than the coarse cells. The reach has a 10 m-wide, 1 m-deep channel, a bed slope of 0.001, and Manning's . The explicit reference uses 10 m cells. The ordinary and Neal (2012) simulations use 30 m cells.
A constant inflow of is applied to an initially dry, 30-cell reach. Because the discharge remains below bankfull, the test evaluates channel storage, wave travel, and stage without floodplain flow.
| Coarse model | Discharge RMSE (m³/s) | NSE | Stage RMSE (m) | Profile RMSE (m) |
|---|---|---|---|---|
| Ordinary | 0.677 | 0.561 | 0.689 | 0.689 |
| Neal (2012) | 0.098 | 0.991 | 0.053 | 0.059 |
The ordinary coarse grid treats the full 30 m cell width as flowing water. It therefore stores too much water and delays the hydrograph. The embedded 10 m channel gives a stage and travel time much closer to the explicit reference.
Composite channel
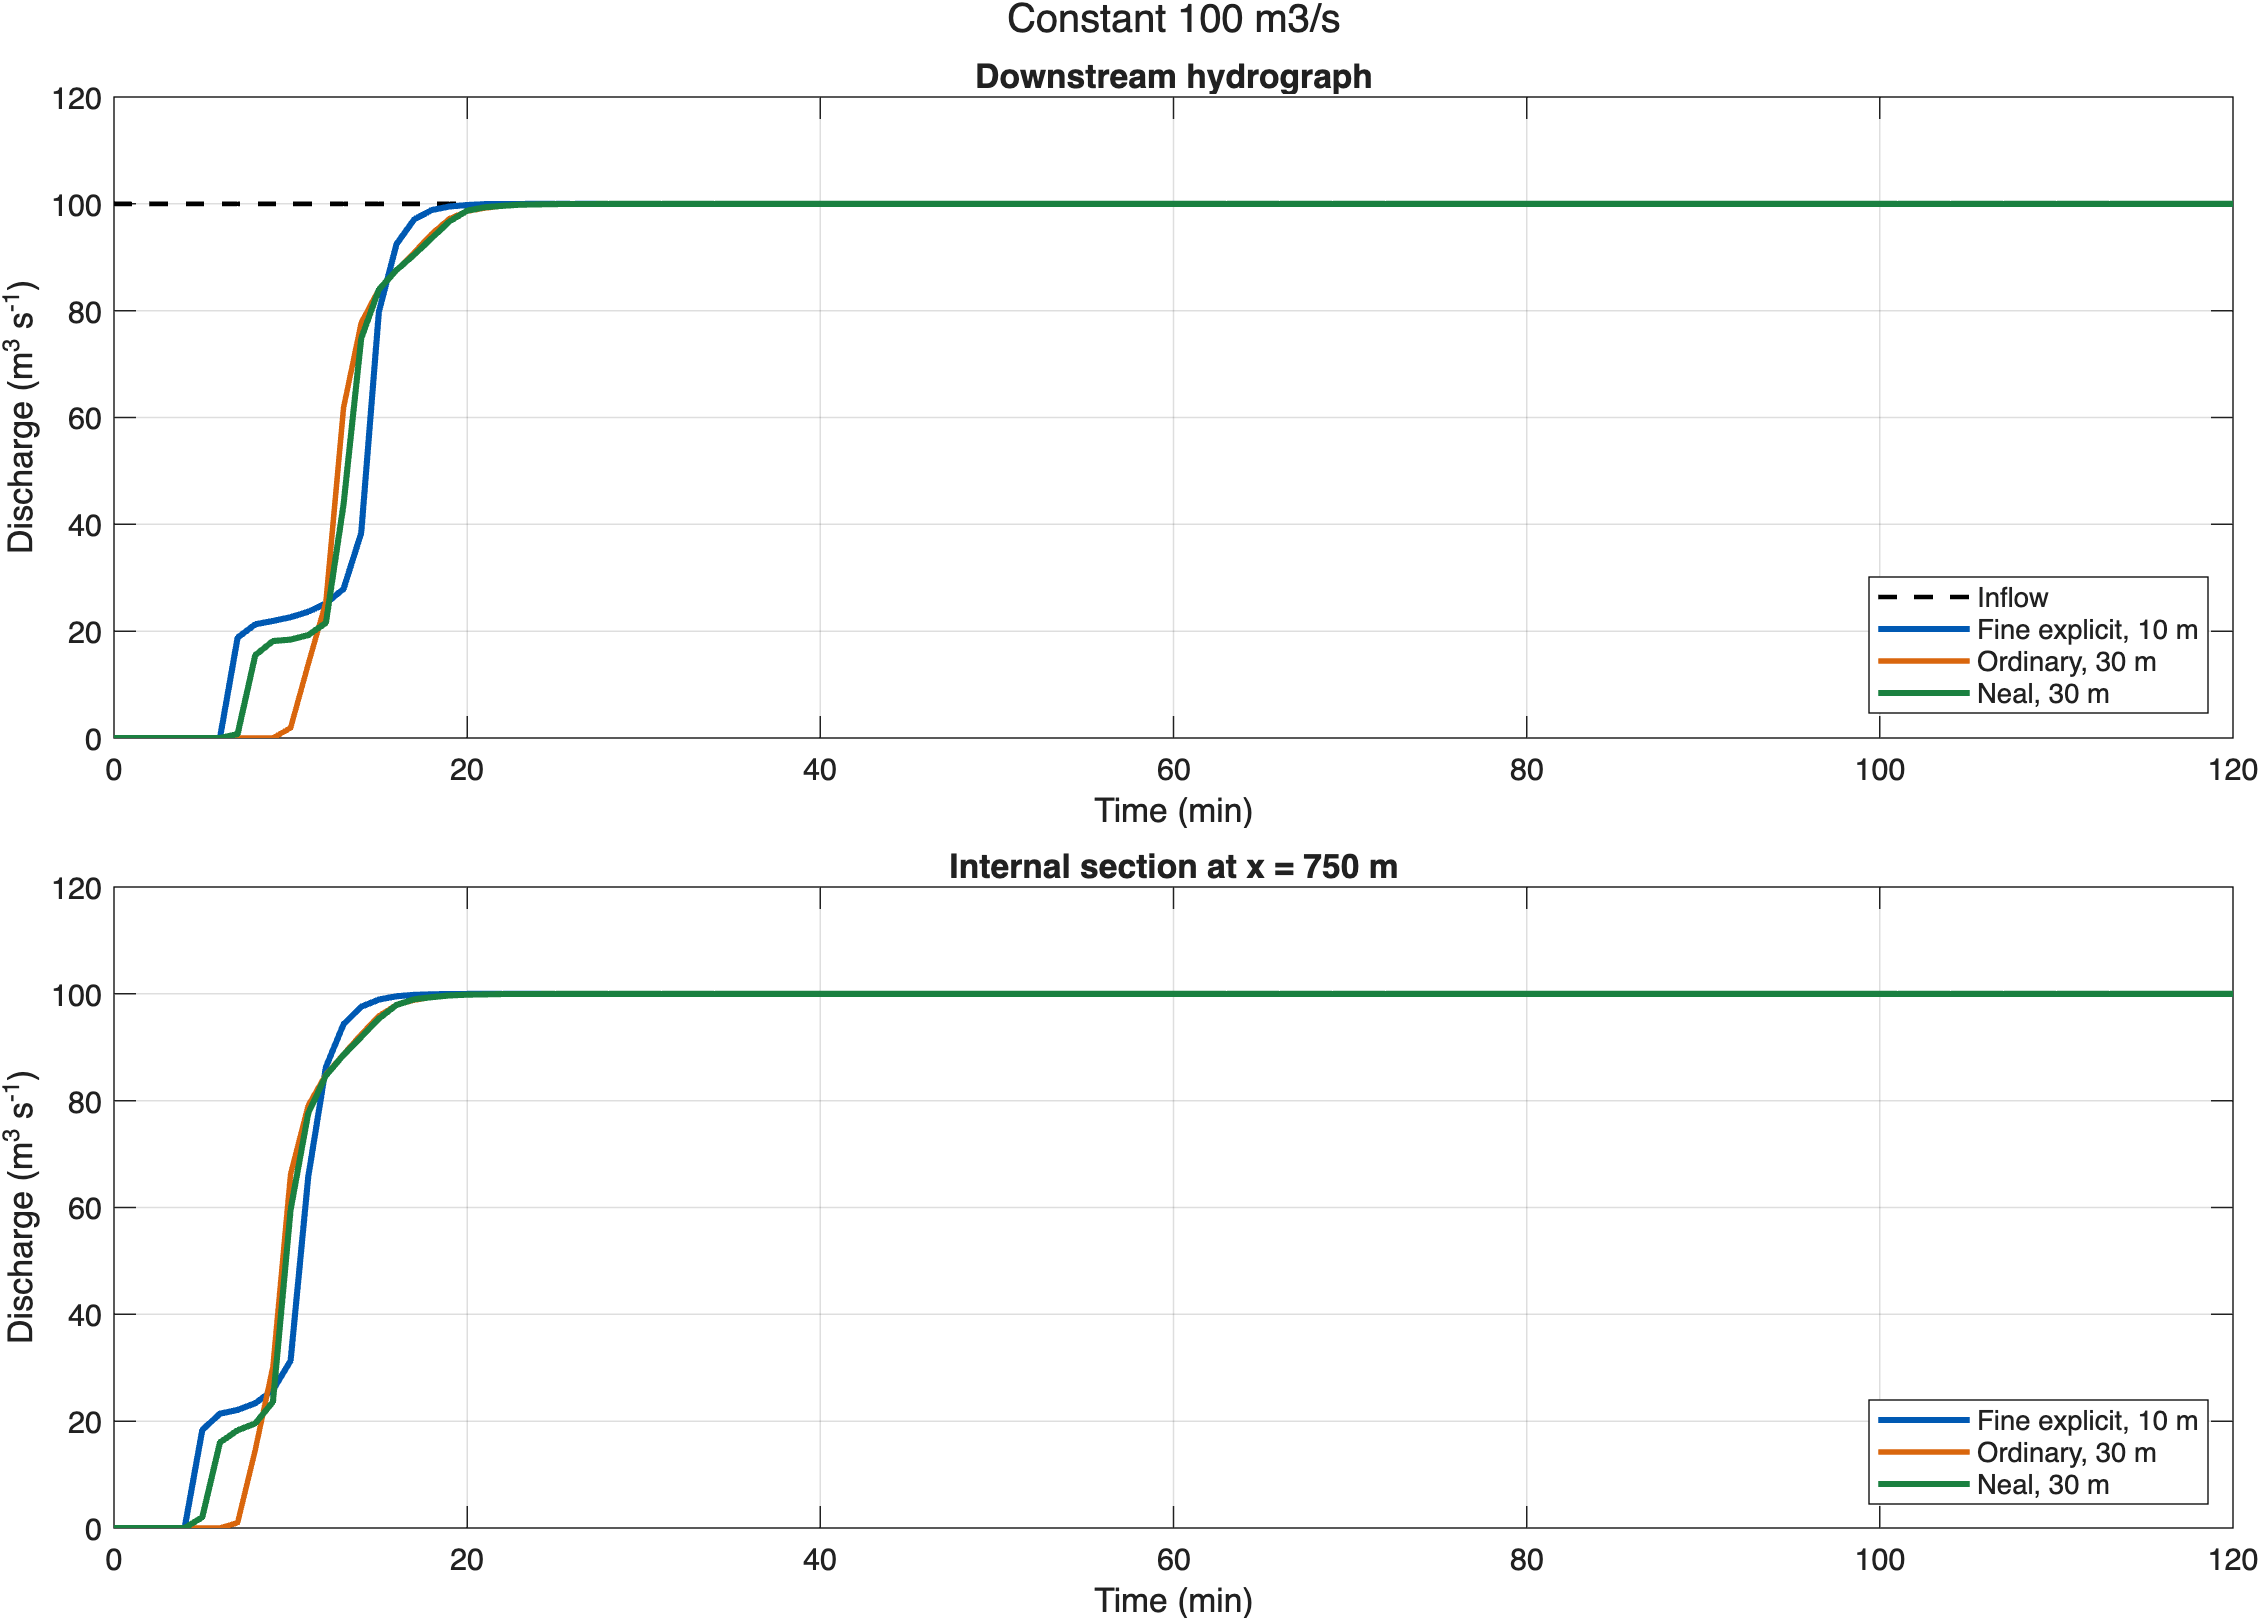
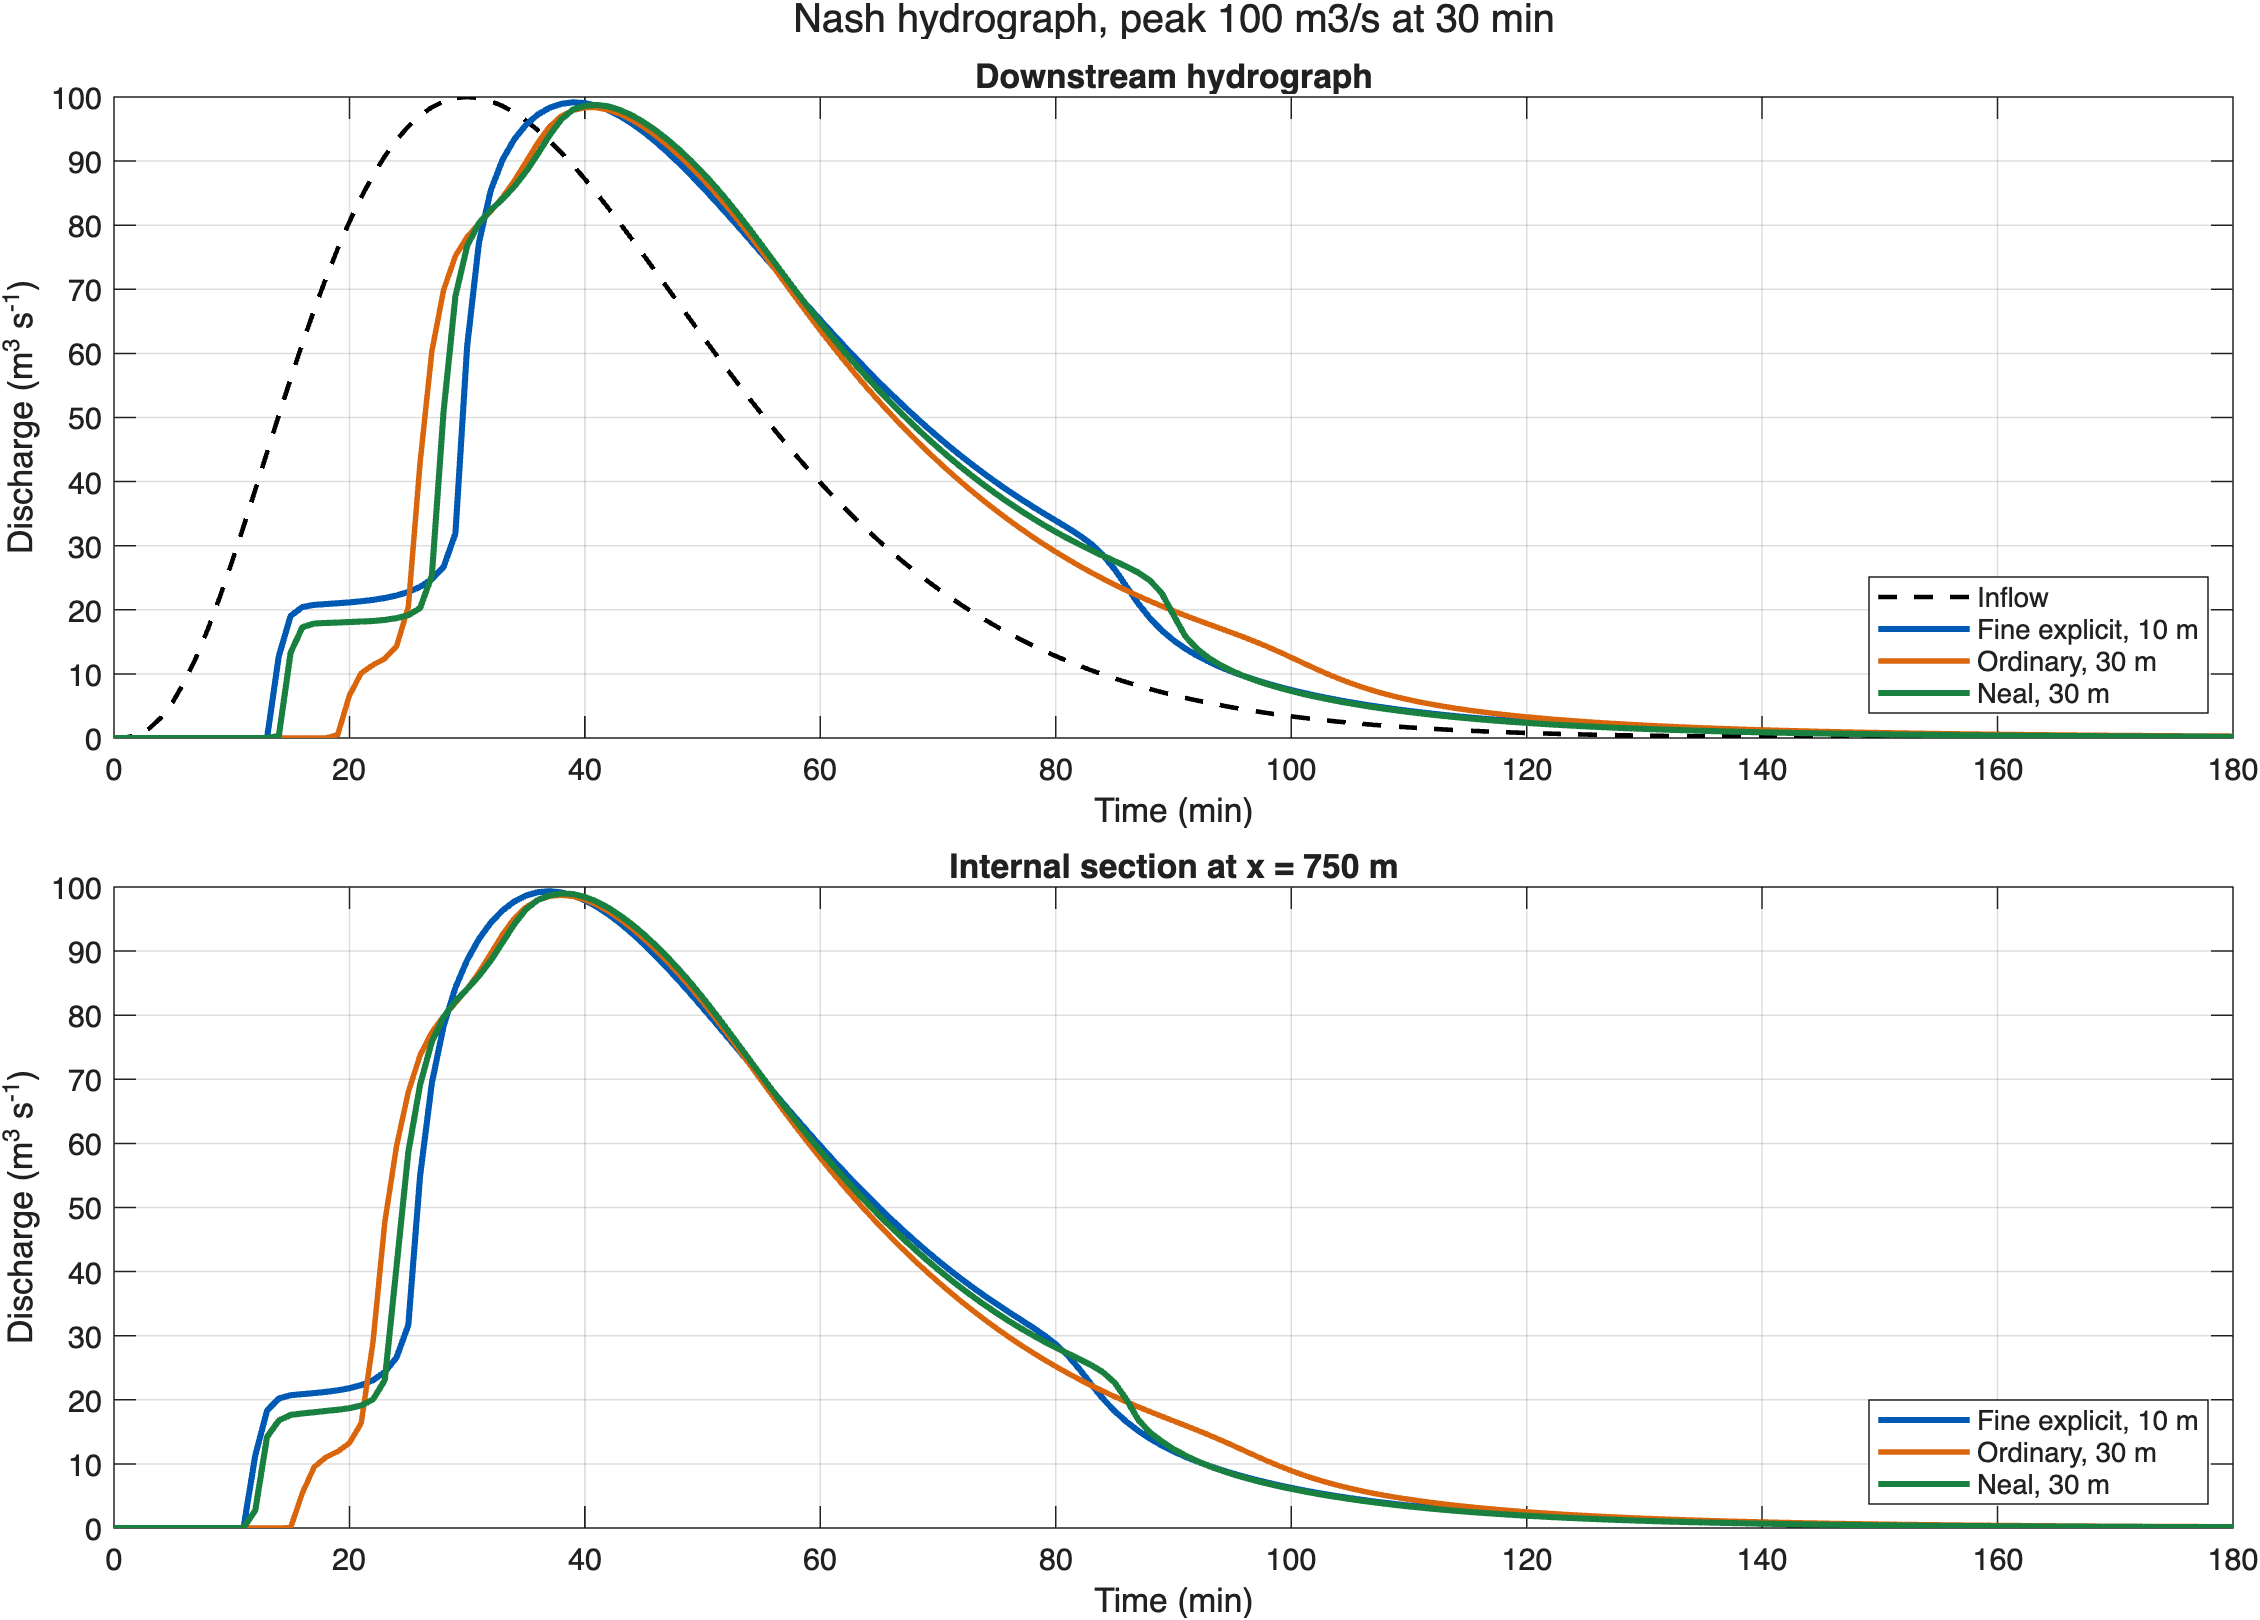
The second case uses a 990 m reach with a 10 m-wide, 1 m-deep channel and 90 m floodplain benches on both sides. The longitudinal slope is 0.005, and Manning's is used throughout. The explicit reference uses 10 m cells; both coarse simulations use 30 m cells.
The constant-flow test applies . The transient test applies a Nash hydrograph with a peak of at 30 min.
| Forcing | Coarse model | Outlet RMSE (m³/s) | Outlet NSE | Internal RMSE (m³/s) | Storage RMSE (m³) |
|---|---|---|---|---|---|
| Constant | Ordinary | 6.178 | 0.954 | 4.819 | 2,439 |
| Constant | Neal (2012) | 4.189 | 0.979 | 3.346 | 734 |
| Nash hydrograph | Ordinary | 7.263 | 0.949 | 5.770 | 3,363 |
| Nash hydrograph | Neal (2012) | 4.044 | 0.984 | 2.987 | 781 |
The Neal (2012) simulation reduces discharge and storage errors for both forcing conditions. The transient comparison also shows that the improvement is retained during the rising limb, peak, and recession.
Staged overbank flow
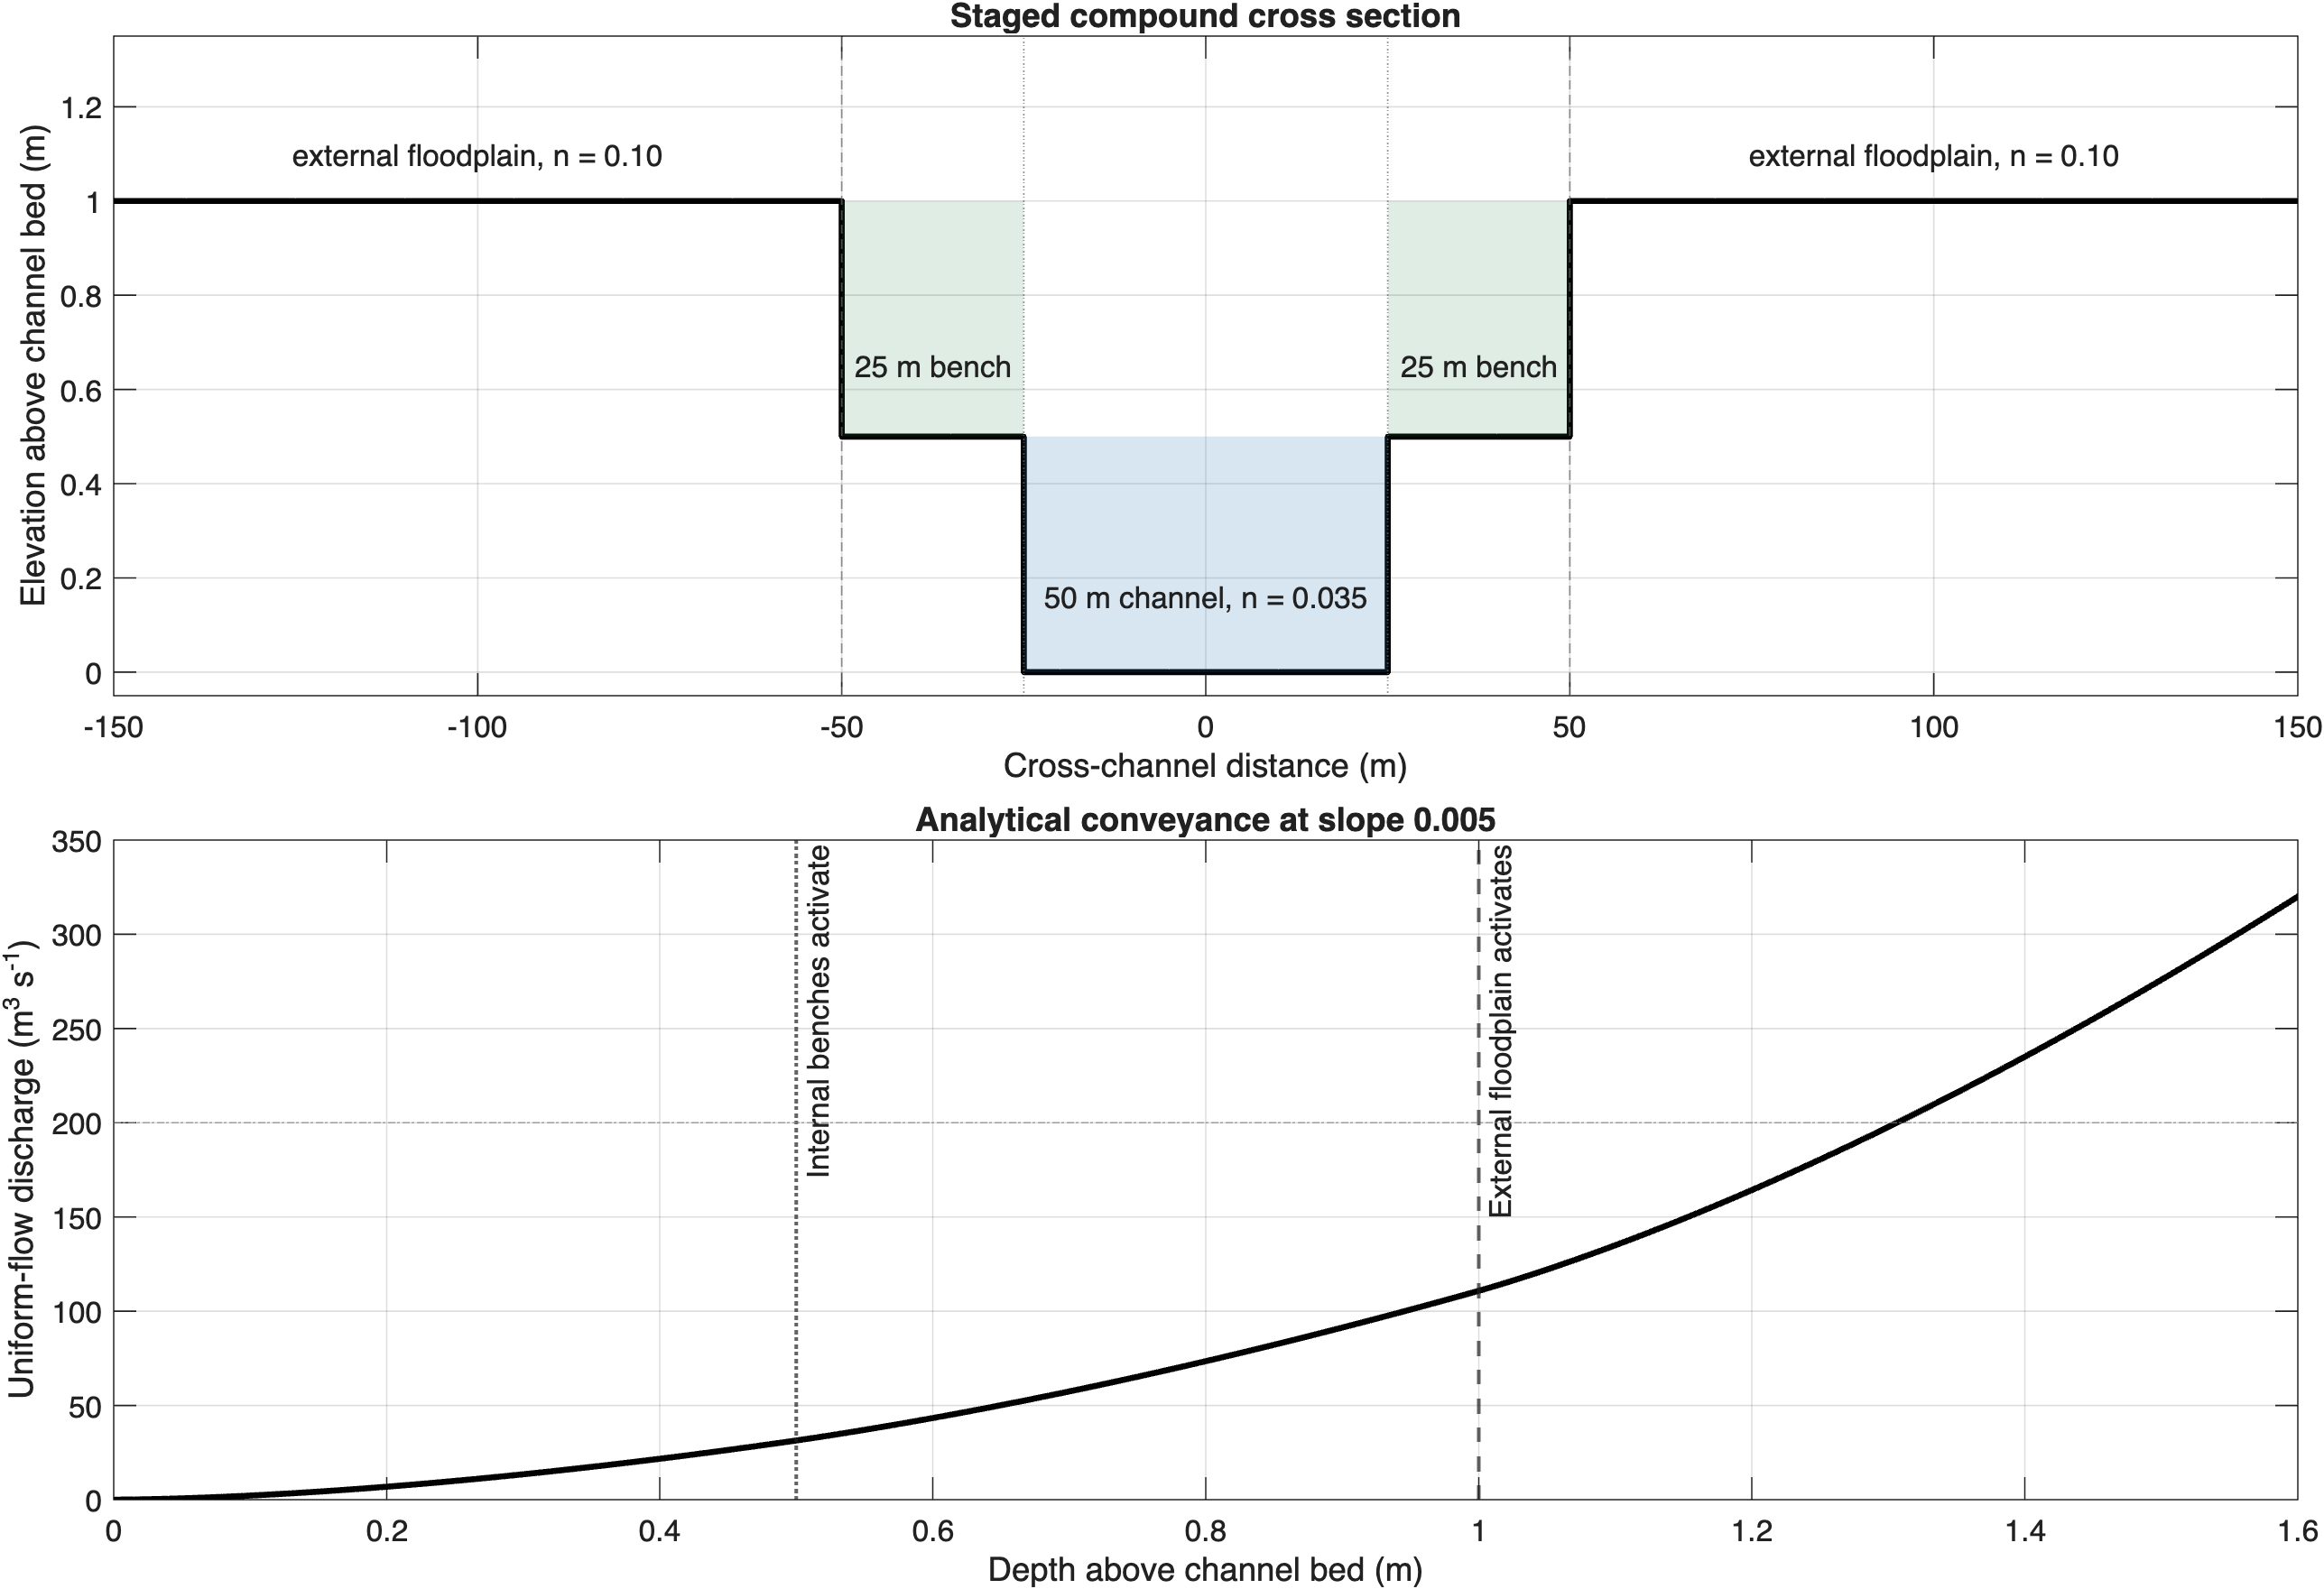
The third case tests the transition from channel flow to floodplain inundation. The 1 km reach is 300 m wide and has a longitudinal slope of 0.005. Its cross section contains:
- a
50 mchannel with Manning's ; - two
25 mbenches, each0.5 mabove the channel bed; - an external floodplain at
1.0 mabove the channel bed with Manning's .
The explicit reference uses 5 m cells. The ordinary and Neal (2012) simulations use 100 m cells. A Nash hydrograph reaches at 45 min, exceeding the analytical activation discharges of for the benches and for the external floodplain.
| Metric | Ordinary, 100 m | Neal (2012), 100 m |
|---|---|---|
| Outlet RMSE (m³/s) | 15.476 | 2.723 |
| Outlet NSE | 0.945 | 0.998 |
| Internal-section RMSE (m³/s) | 12.053 | 3.043 |
| Bench-depth RMSE (m) | 0.180 | 0.018 |
| Maximum-depth RMSE (m) | 0.280 | 0.040 |
| Wet-area CSI at 0.01 m | 0.334 | 0.998 |
The Neal (2012) model reproduces the bench activation at 21 min, the same time as the explicit reference. It activates the external floodplain at 35 min, compared with 34 min in the reference. The hydrograph, depth, and maximum inundation extent are all closer to the reference than the ordinary 100 m result.
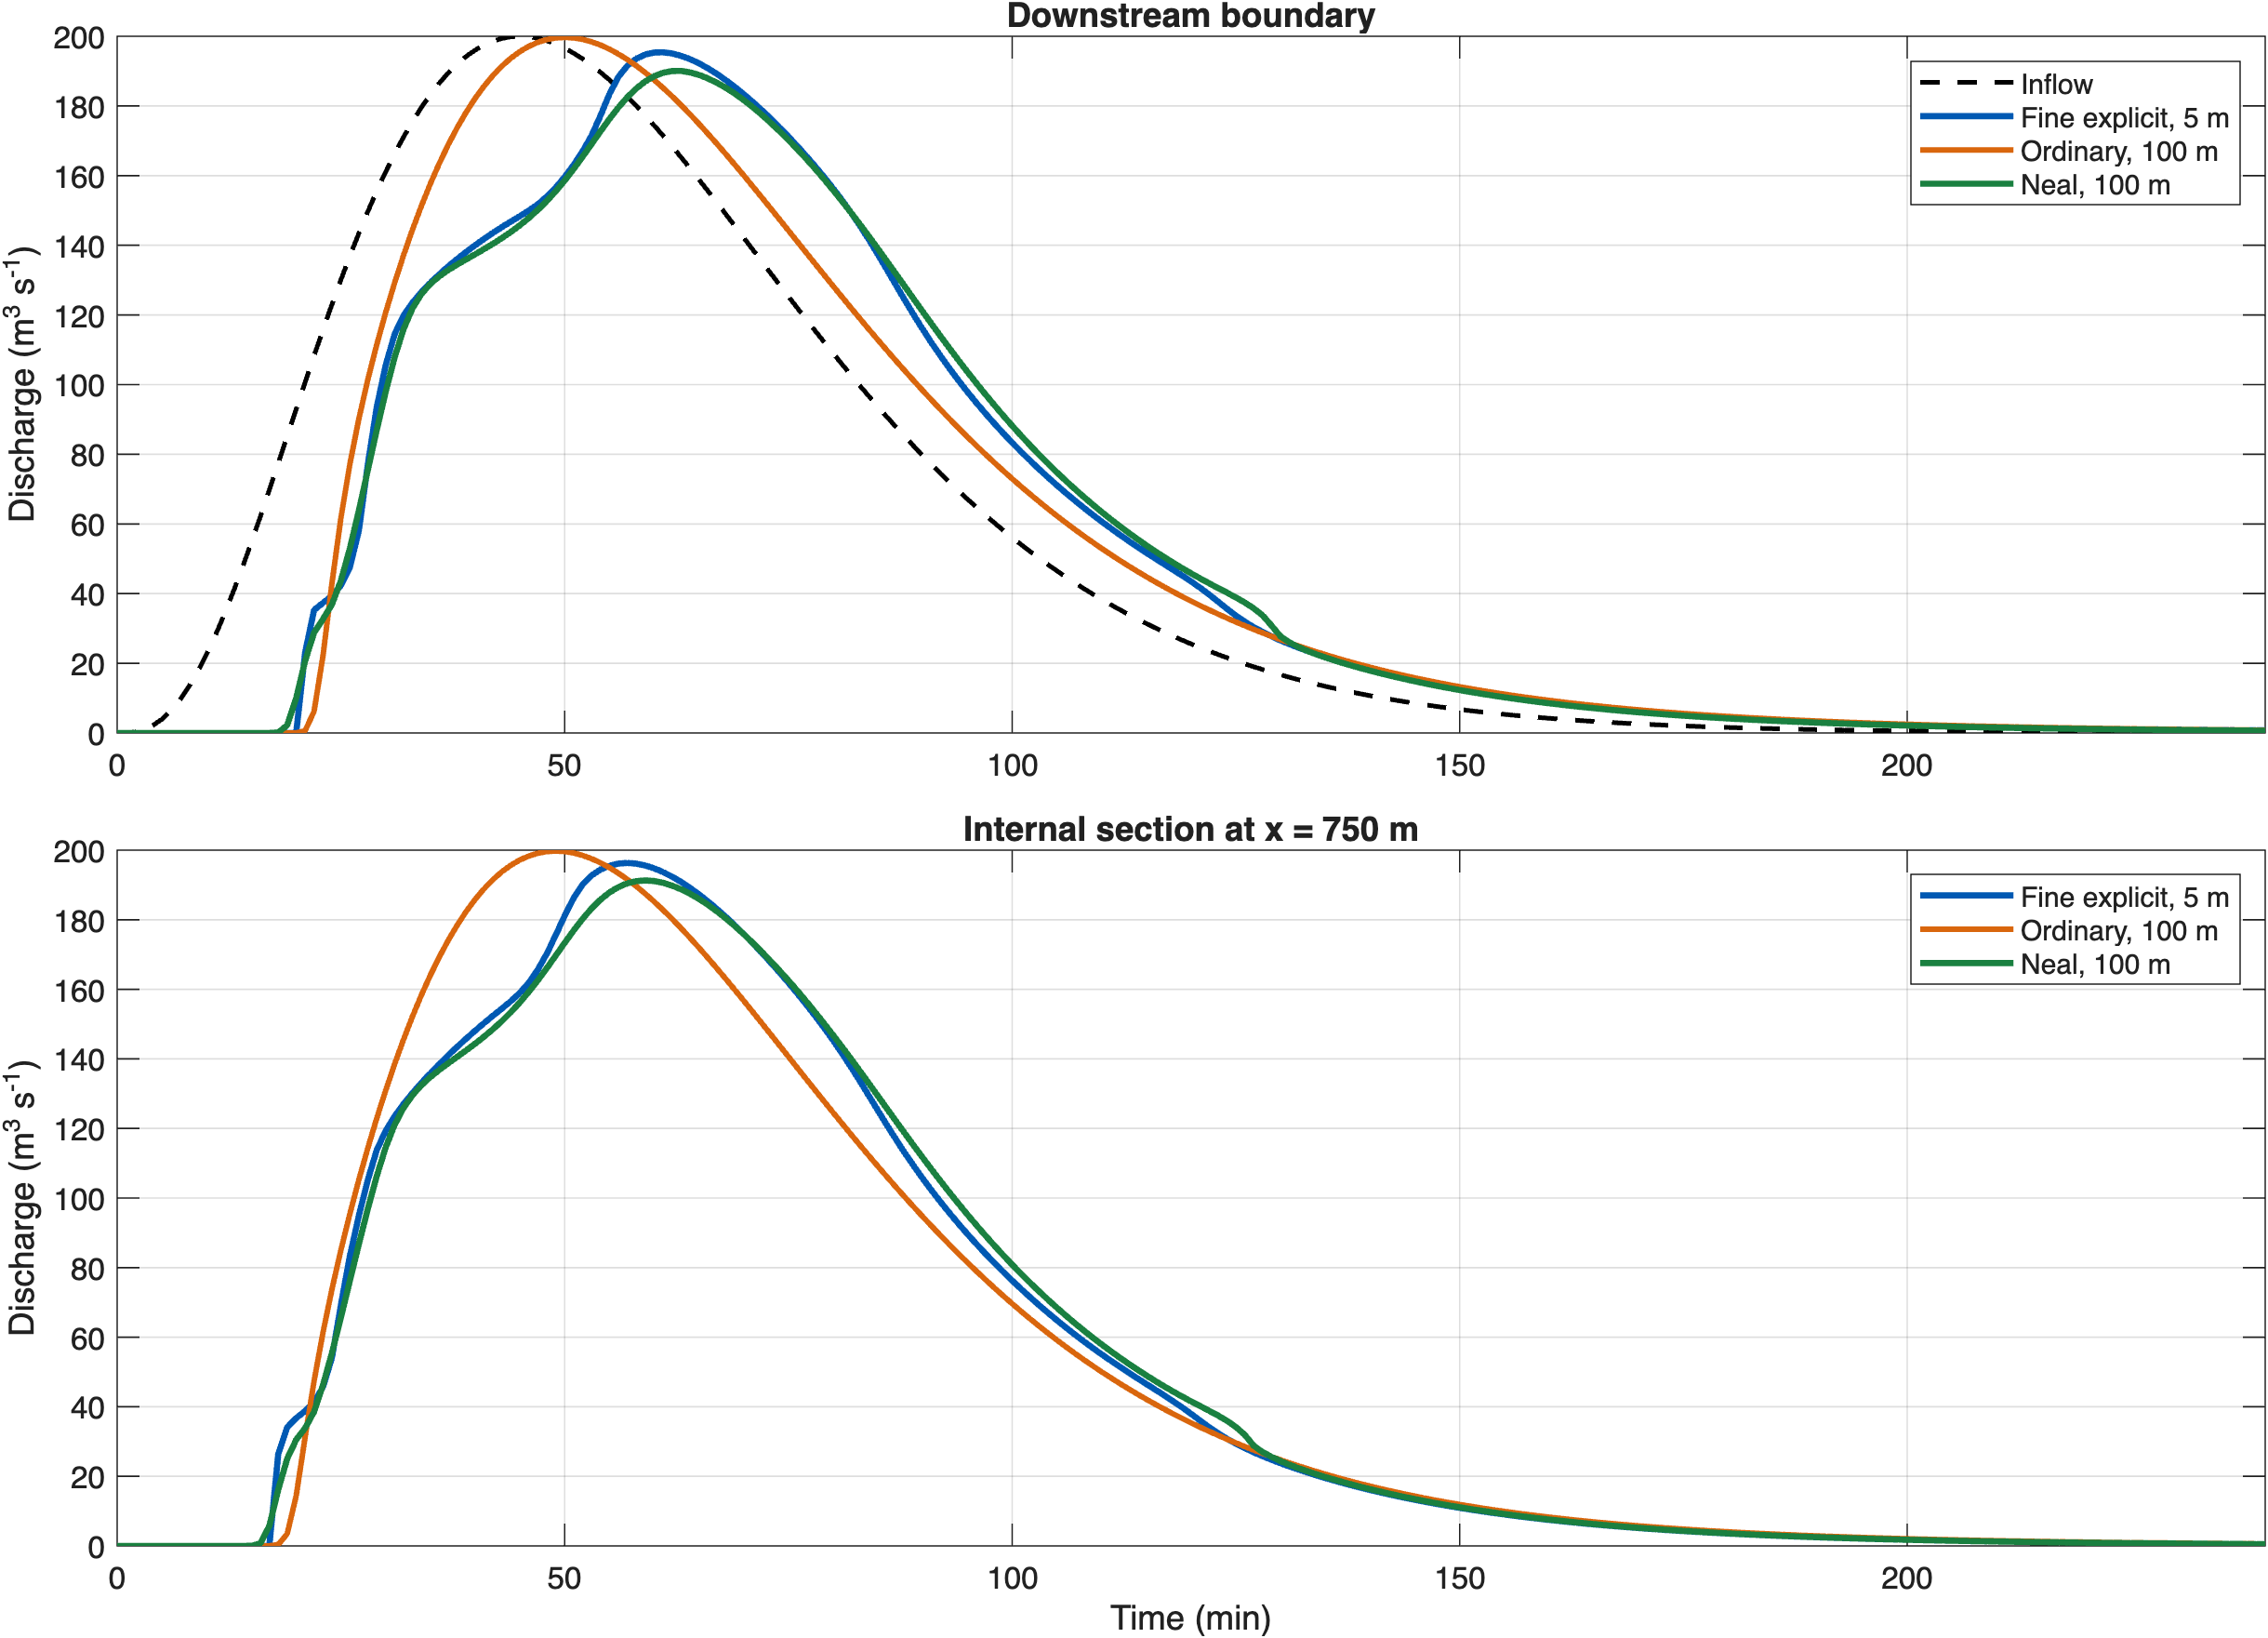
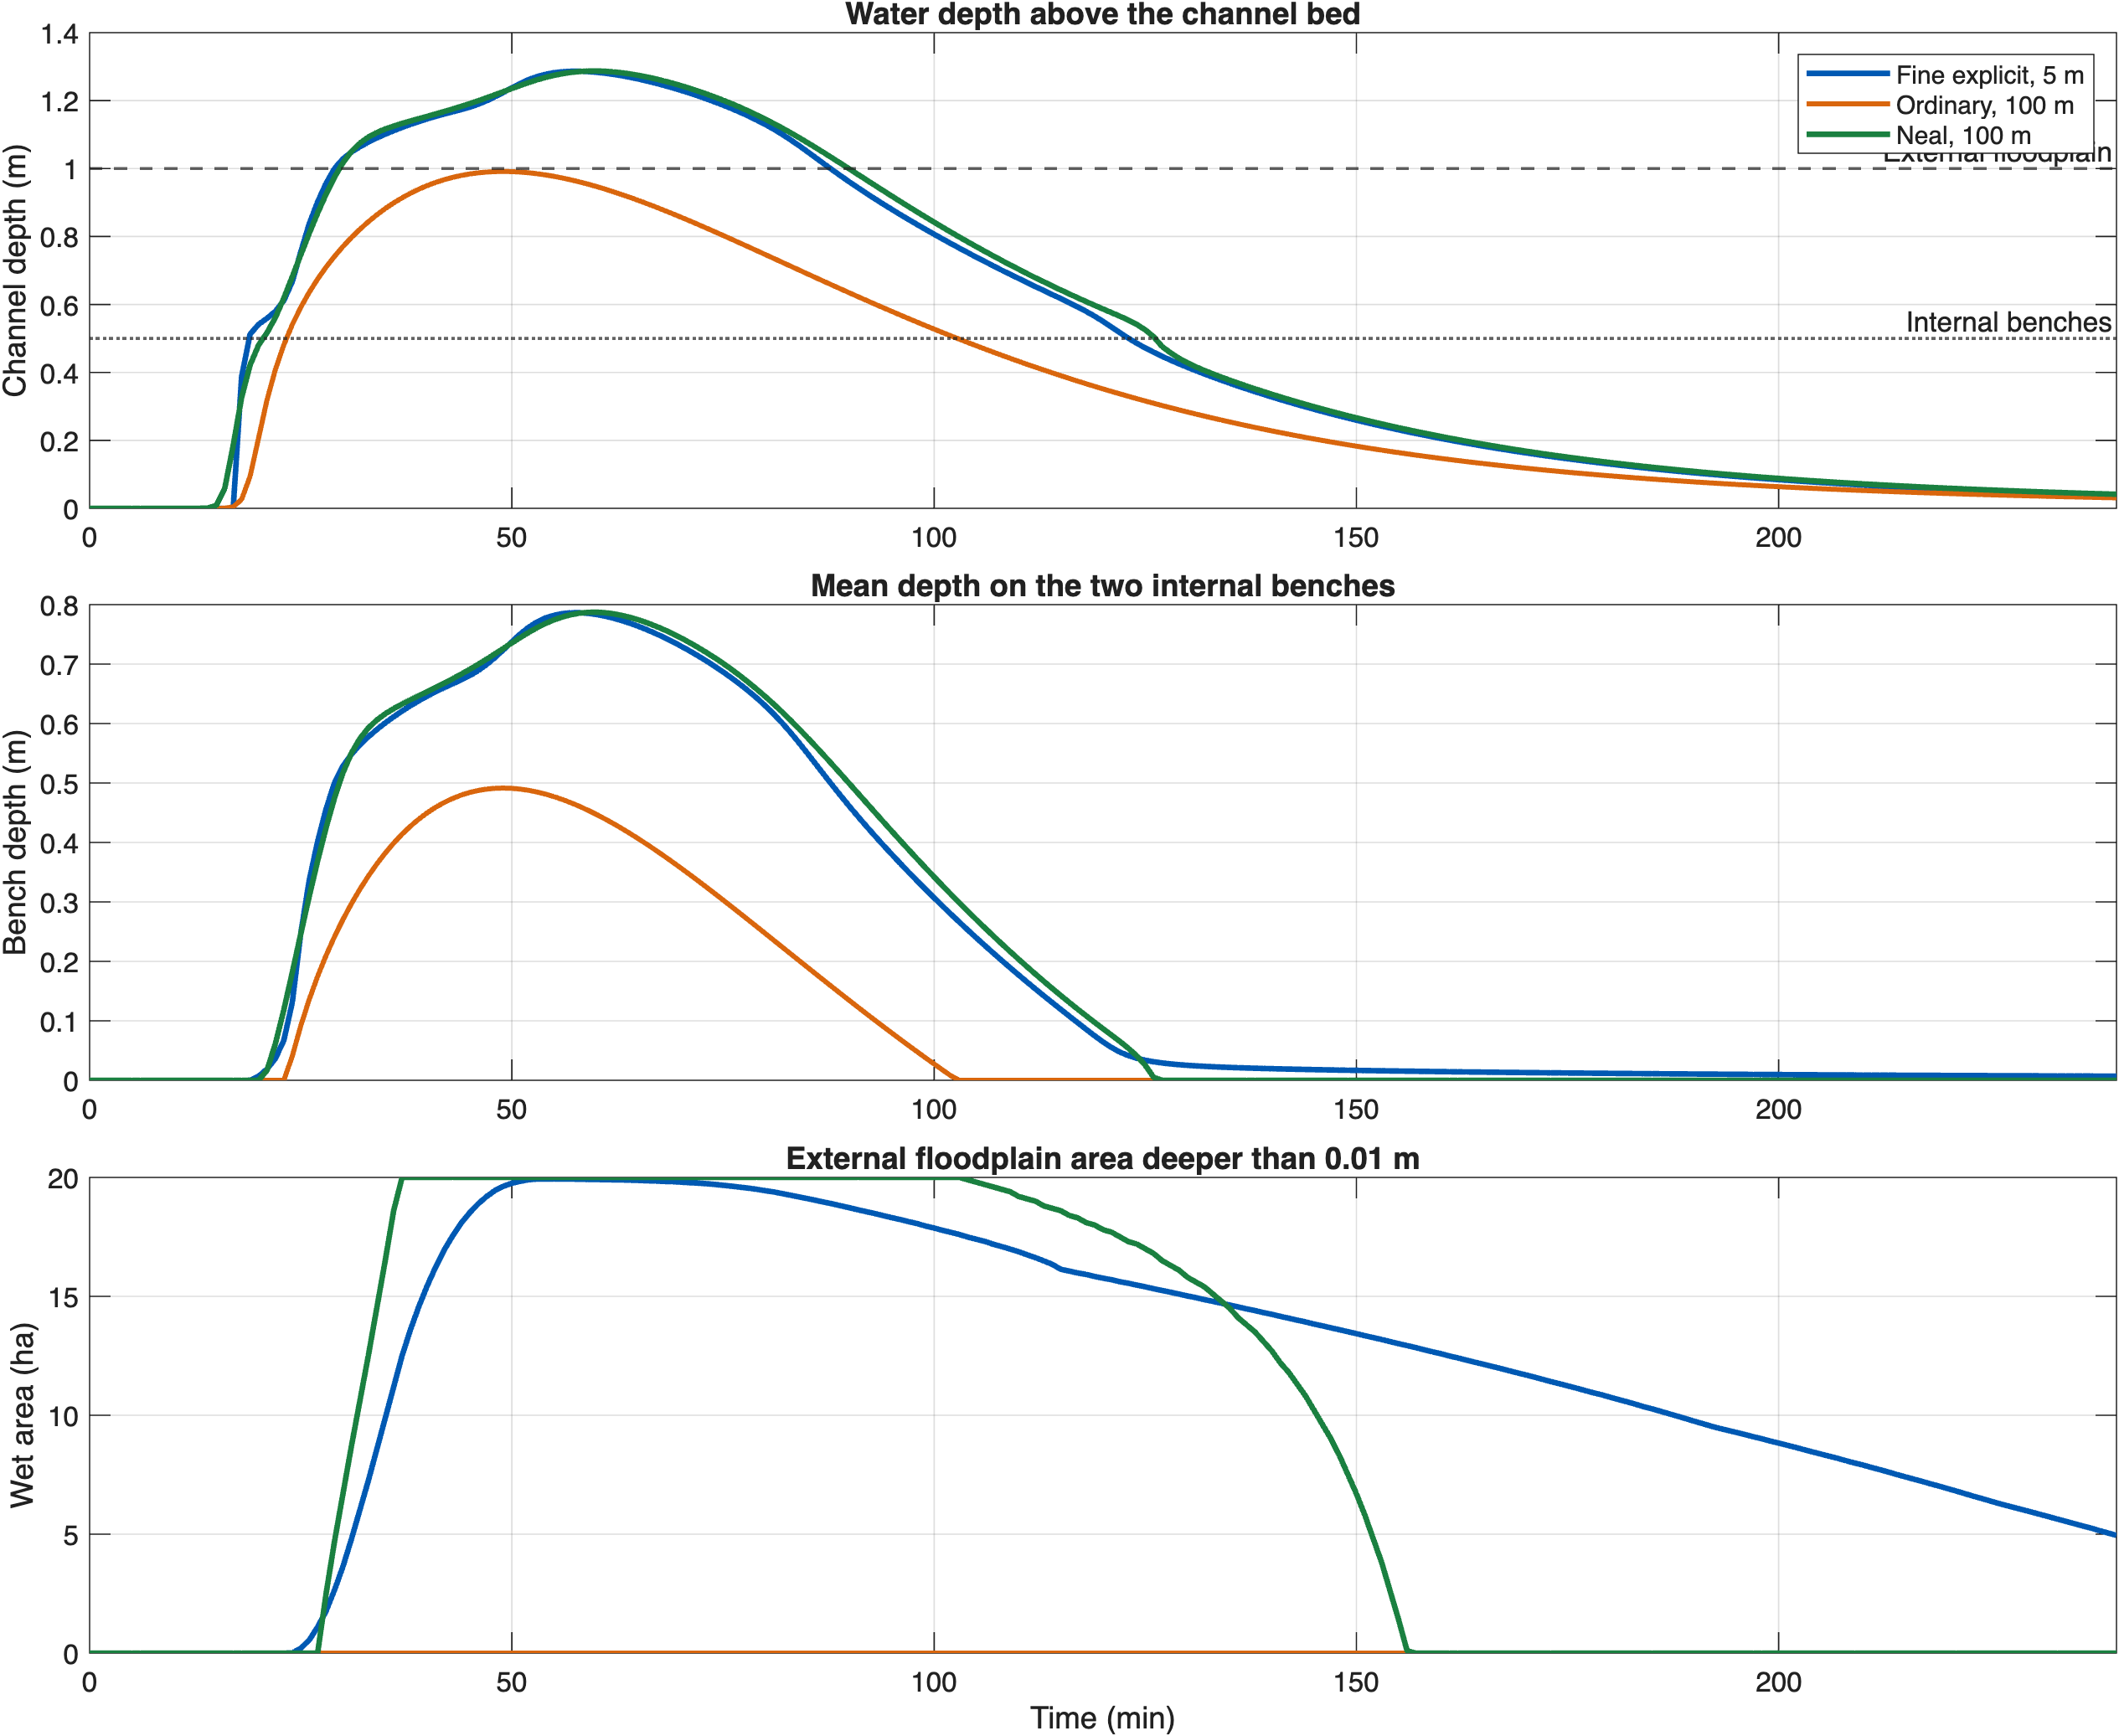

All retained cases conserve water to numerical precision. The staged test also identifies a limitation. The Neal (2012) benches become dry at 126 min, compared with 196 min in the explicit reference, and the external floodplain becomes dry at 152 min, compared with 237 min. A coarse Neal (2012) cell has one representative water level, so residual water on benches and floodplains cannot drain independently from the embedded channel.
Supported interpretation
These tests support the Neal (2012) formulation for controlled in-bank routing, channel-to-floodplain activation, peak hydraulics, and maximum inundation extent within the tested geometries. They do not establish field-scale accuracy. Applications with long floodplain recessions should evaluate drainage timing against observations or a finer hydraulic reference.
The equations and required inputs are described in the hydrodynamic model and model flags pages.