San Francisquito Catchment - Controlled Rainfall Example
Purpose
This example presents a controlled rainfall-runoff simulation for the San Francisquito catchment near Stanford, California. It shows how HydroPol2D is configured for a realistic watershed domain under a prescribed storm.
Case setup
The case Stanford_30m_100mmh_1h_24h uses:
| Item | Value |
|---|---|
| Domain | San Francisquito sub-catchment, California, USA |
| Grid resolution | 30 m |
| Forcing type | Spatially invariant rainfall |
| Rainfall event | 100 mm/h for 1 hour |
| Simulation duration | 24 h |
| Map output interval | 15 min |
| Routing family | Local inertial |
| Outlet treatment | Perimeter outlet |
Input data
The static inputs were prepared from a Google Earth Engine workflow and aligned to a 30 m grid over the catchment. The main layers used in the current example are:
- DEM;
- land use and land cover;
- soil texture;
- depth to bedrock or soil depth.
The simulation uses the current HydroPol2D layered soil and vadose formulation. Parameter values come from the Stanford configuration distributed with the model.
What this case is meant to show
This case highlights:
- runoff generation under a simple, known forcing;
- the interaction between topography, roughness, and infiltration;
- the spatial organization of routed flood depth, velocity, hazard, and cumulative infiltration;
- long recession behavior after the rainfall pulse ends.
Input maps
Figure 1 - Terrain and drainage
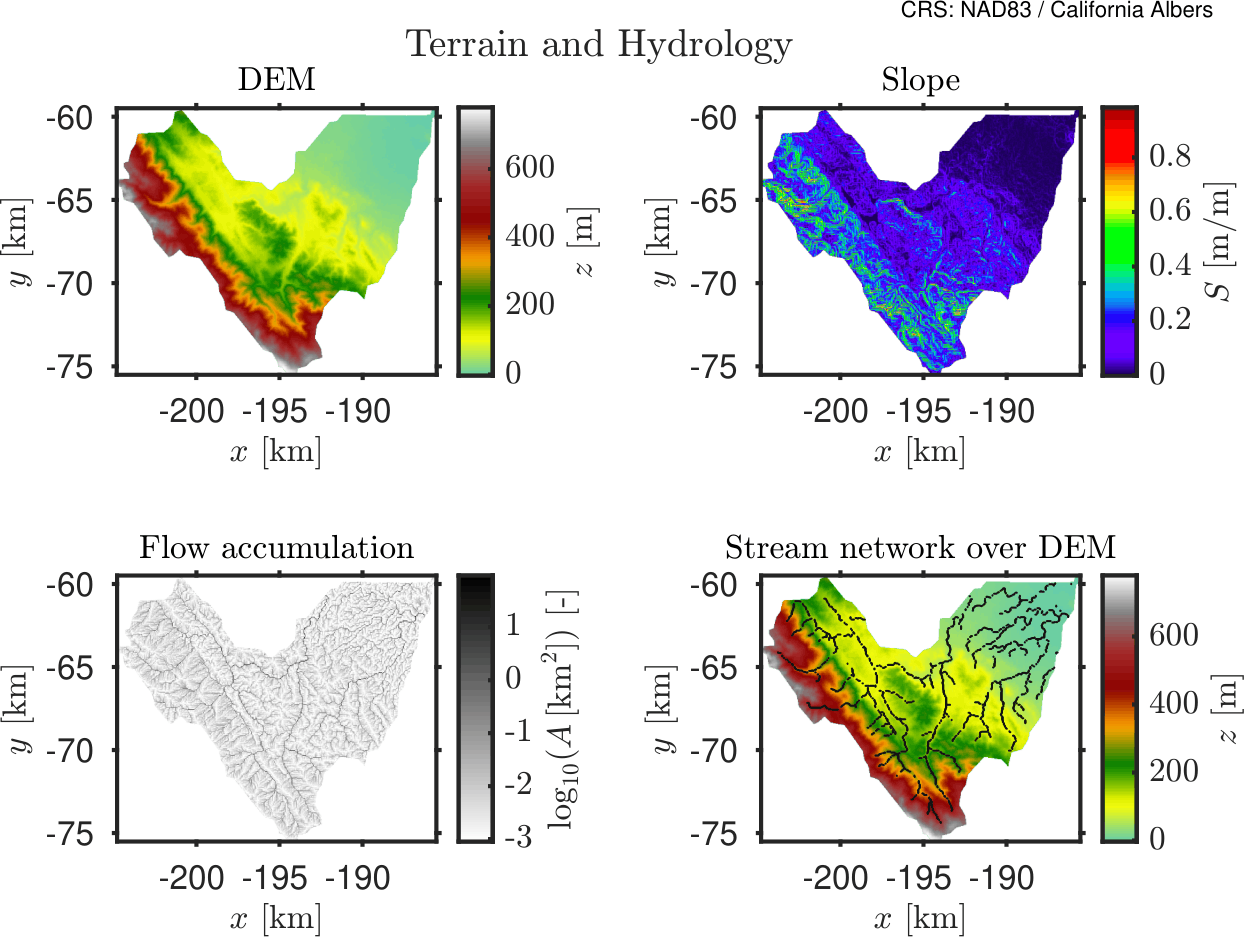
Figure 2 - Surface properties
-1-10bce2021e35c69dfd7c568980eef00d.png)
Figure 3A - Soil hydraulic properties
-1-741276128e022d42e5663ccb21ac12b9.png)
Figure 3B - Soil retention and storage
-1-0137ac58820a8e583b9767af20bdc460.png)
Simulation video
The animation below shows the 30 m simulation. The panels show flood depth, velocity, hazard metric, and cumulative infiltration.
Stanford 30 m controlled rainfall simulation: flood depth, velocity, hazard, and cumulative infiltration.
Each panel uses one color scale for the full sequence. The scale is based on the 99th percentile of all saved frames.
Summary results
The simulation produced 97 saved map frames. Summary metrics are:
- a drainage area of
156.823 km²; - a run-total rainfall depth of
100 mm; - a maximum flood depth of
0.64 m; - a peak outlet flow of
335.03 m³/s; - preprocessing figures for terrain, surface properties, and soil properties.