Hydrologic Module Validation
This page documents the Phase 1 validation cases for canopy interception, snow, infiltration, and evapotranspiration. These cases were designed to answer a narrow question first: does each module reproduce the intended equations and storage bookkeeping under controlled conditions? The answer is then separated from later questions about field parameters, calibration, and watershed performance.
Shared setup
Most hydrologic cases use the synthetic V-tilted catchment as a shared spatial context. That domain provides a consistent DEM, soil, land-cover, LAI, and groundwater framework, but the truth source still comes from an analytical solution or an independent reference implementation.
Canopy interception
What was tested
Case P1-CANOPY-001 isolates the canopy storage routine before infiltration, runoff, and groundwater are activated. The left hillslope uses LAI = 0.5, the channel strip uses LAI = 0, and the right hillslope uses LAI = 2.0. A representative 20 m × 20 m cell is used for volume conversion.
Reference and method
The HydroPol2D routine interceptionModel.m was run directly and compared with an independent canopy-bucket reference. The case covers canopy filling, throughfall once storage capacity is exceeded, evaporation drawdown, and an LAI = 0 bypass.
Main result
HydroPol2D matched the independent reference to round-off precision. The benchmark, mass-balance, and NaN checks all passed.
| Metric | Value | Threshold |
|---|---|---|
| Canopy storage RMSE (mm) | 1.50 × 10^-17 | 1.0 × 10^-9 |
| Throughfall RMSE (mm) | 1.31 × 10^-17 | 1.0 × 10^-9 |
| Evaporation RMSE (mm) | 7.31 × 10^-18 | 1.0 × 10^-9 |
| Maximum mass residual (m³) | 2.22 × 10^-17 | 1.0 × 10^-6 |
This case validates the implemented canopy formulas and storage bookkeeping for the tested conditions. It does not validate field canopy interception behavior because Phase 1 does not use observed throughfall or stemflow data.
Snow module
What was tested
Case P1-SNOW-001 applies prescribed cold, transitional, and warm forcings to representative V-tilted zones. The goal is to test rain-snow partitioning, snow water equivalent (SWE), snow depth, snow density, melt, sublimation, and snowpack mass closure.
Reference and method
Snow_Model_Function.m was compared with an independent reference that mirrors the active HydroPol2D formulas. The implemented precipitation partition uses the current linear transition between 4 °C and 7 °C. Phase 1 therefore validates the implemented formula, not a configurable threshold formulation.
Main result
HydroPol2D matched the independent reference to round-off precision across all reported variables.
| Metric | Value | Threshold |
|---|---|---|
| SWE RMSE (mm) | 1.59 × 10^-14 | 1.0 × 10^-8 |
| Melt RMSE (mm) | 1.27 × 10^-14 | 1.0 × 10^-8 |
| Snowfall RMSE (mm) | 7.54 × 10^-15 | 1.0 × 10^-8 |
| Rainfall RMSE (mm) | 4.19 × 10^-16 | 1.0 × 10^-8 |
| Sublimation RMSE (mm) | 1.86 × 10^-20 | 1.0 × 10^-8 |
| Maximum mass residual (m³) | 0.0 | 1.0 × 10^-6 |
This validates the implemented snow partition, melt, sublimation, density, depth, and SWE bookkeeping formulas for the tested conditions. It does not validate field snowpack behavior.
Infiltration
What was tested
The infiltration suite uses the V-tilted catchment with physically interpretable USDA-style sandy-loam, loam, and clay-loam hydraulic properties. Seven regimes were tested:
- no-infiltration bypass;
- supply-limited rainfall;
- capacity-limited intake;
- finite-storage saturation excess;
- delayed layered percolation and recharge;
- shallow-groundwater saturation excess;
- spatial soil contrast.
Reference and method
The truth source is an independent MATLAB reference driver that evaluates the intended infiltration and layered-storage bookkeeping outside the full hydrodynamic solver. The tests follow the implemented top-down order: near-surface layer, root-zone layer, transmission layer, and groundwater recharge when vadose storage is full and recharge is active.
Main result
All seven independent infiltration cases passed after the soil properties were reset to physically consistent texture-based values.
| Case | Regime | Rain (mm) | Infiltration (mm) | Runoff (mm) | Recharge (mm) | Closure (mm) |
|---|---|---|---|---|---|---|
P1-INFIL-VT-000 | No infiltration | 60.0 | 0.0 | 60.0 | 0.0 | 0.0 |
P1-INFIL-VT-001 | Supply limited | 10.0 | 10.0 | 0.0 | 0.0 | 0.0 |
P1-INFIL-VT-002 | Capacity limited | 120.0 | 34.157 | 85.843 | 0.0 | 1.71 × 10^-13 |
P1-INFIL-VT-003 | Storage limited | 180.0 | 72.5 | 107.5 | 0.0 | 0.0 |
P1-INFIL-VT-004 | Layered percolation | 384.0 | 384.0 | 0.0 | 197.614 | 1.23 × 10^-11 |
P1-INFIL-VT-005 | Shallow groundwater | 150.0 | 75.0 | 75.0 | 22.683 | -2.84 × 10^-14 |
P1-INFIL-VT-006 | Spatial soil contrast | 120.0 | 77.880 | 42.120 | 0.0 | 7.11 × 10^-15 |
The main interpretation is process-level, not just numerical. The supply-limited case infiltrated the full rainfall input. The capacity-limited case generated excess once rainfall exceeded hydraulic intake capacity. The storage-limited case filled the vadose store and then produced saturation-excess runoff. The layered-percolation case delayed recharge instead of sending water directly to groundwater.
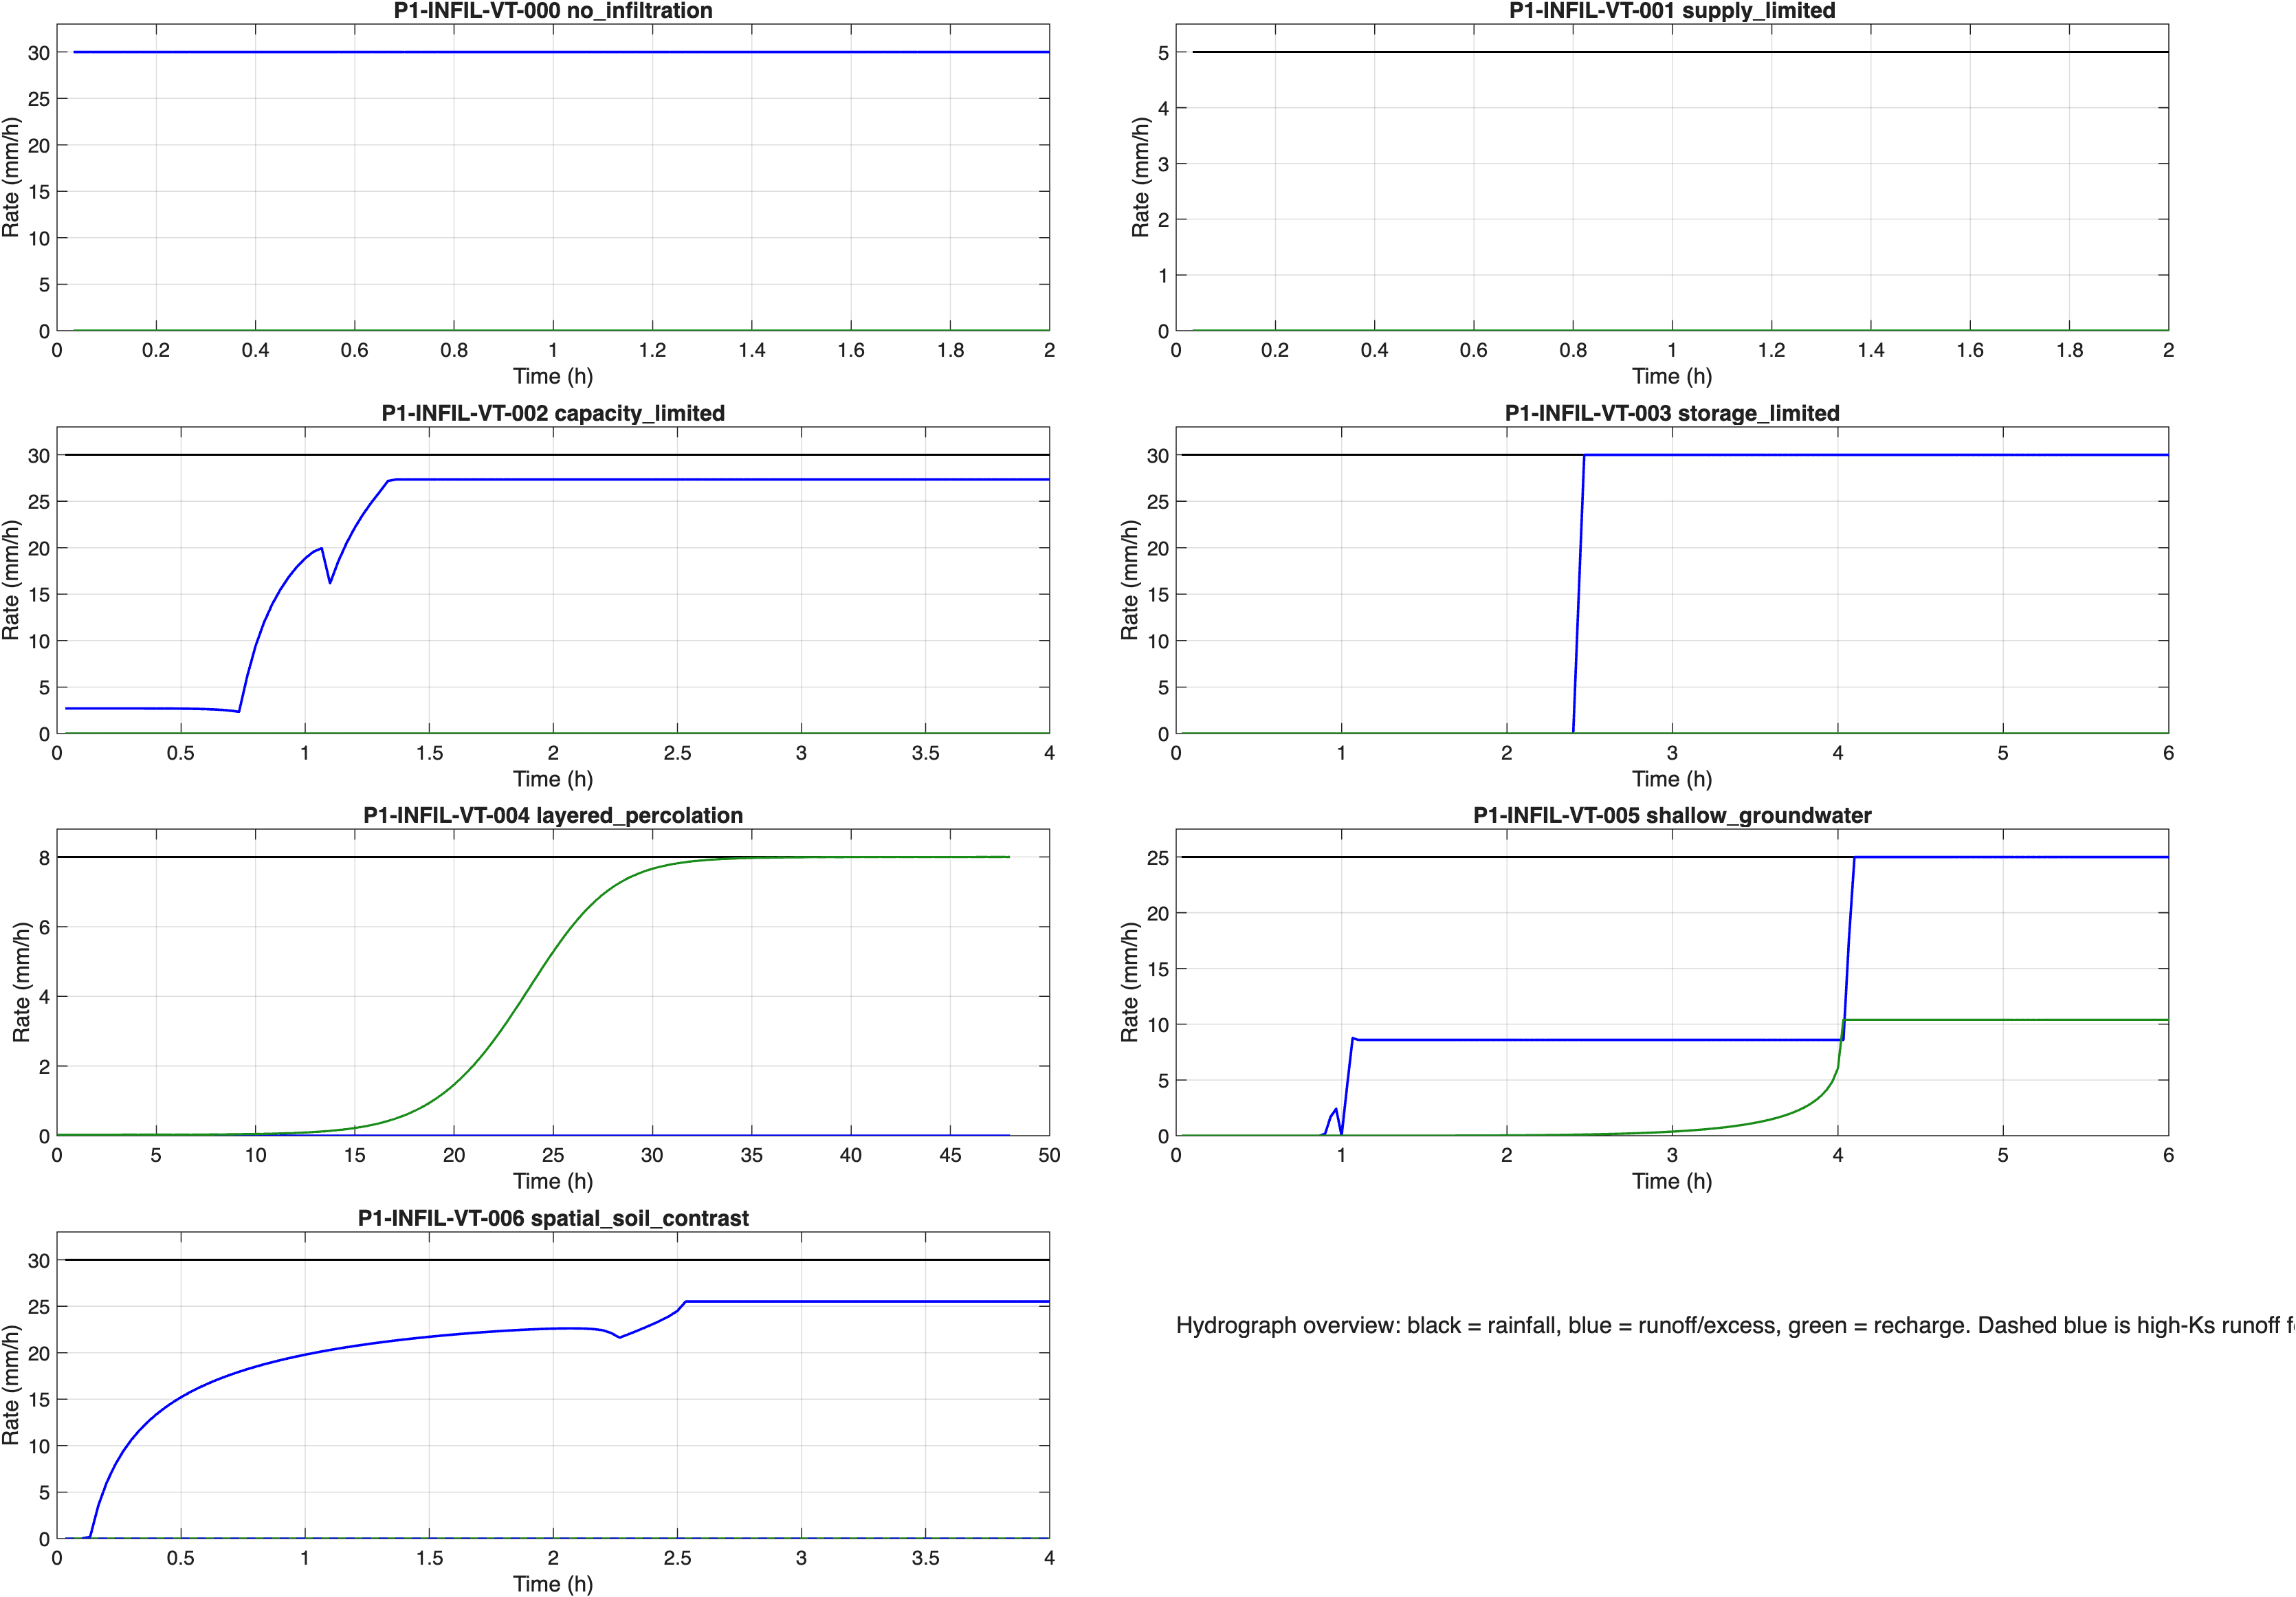
Hydrograph-style infiltration diagnostics. Black lines are rainfall, blue lines are runoff or surface excess, and green lines are recharge.
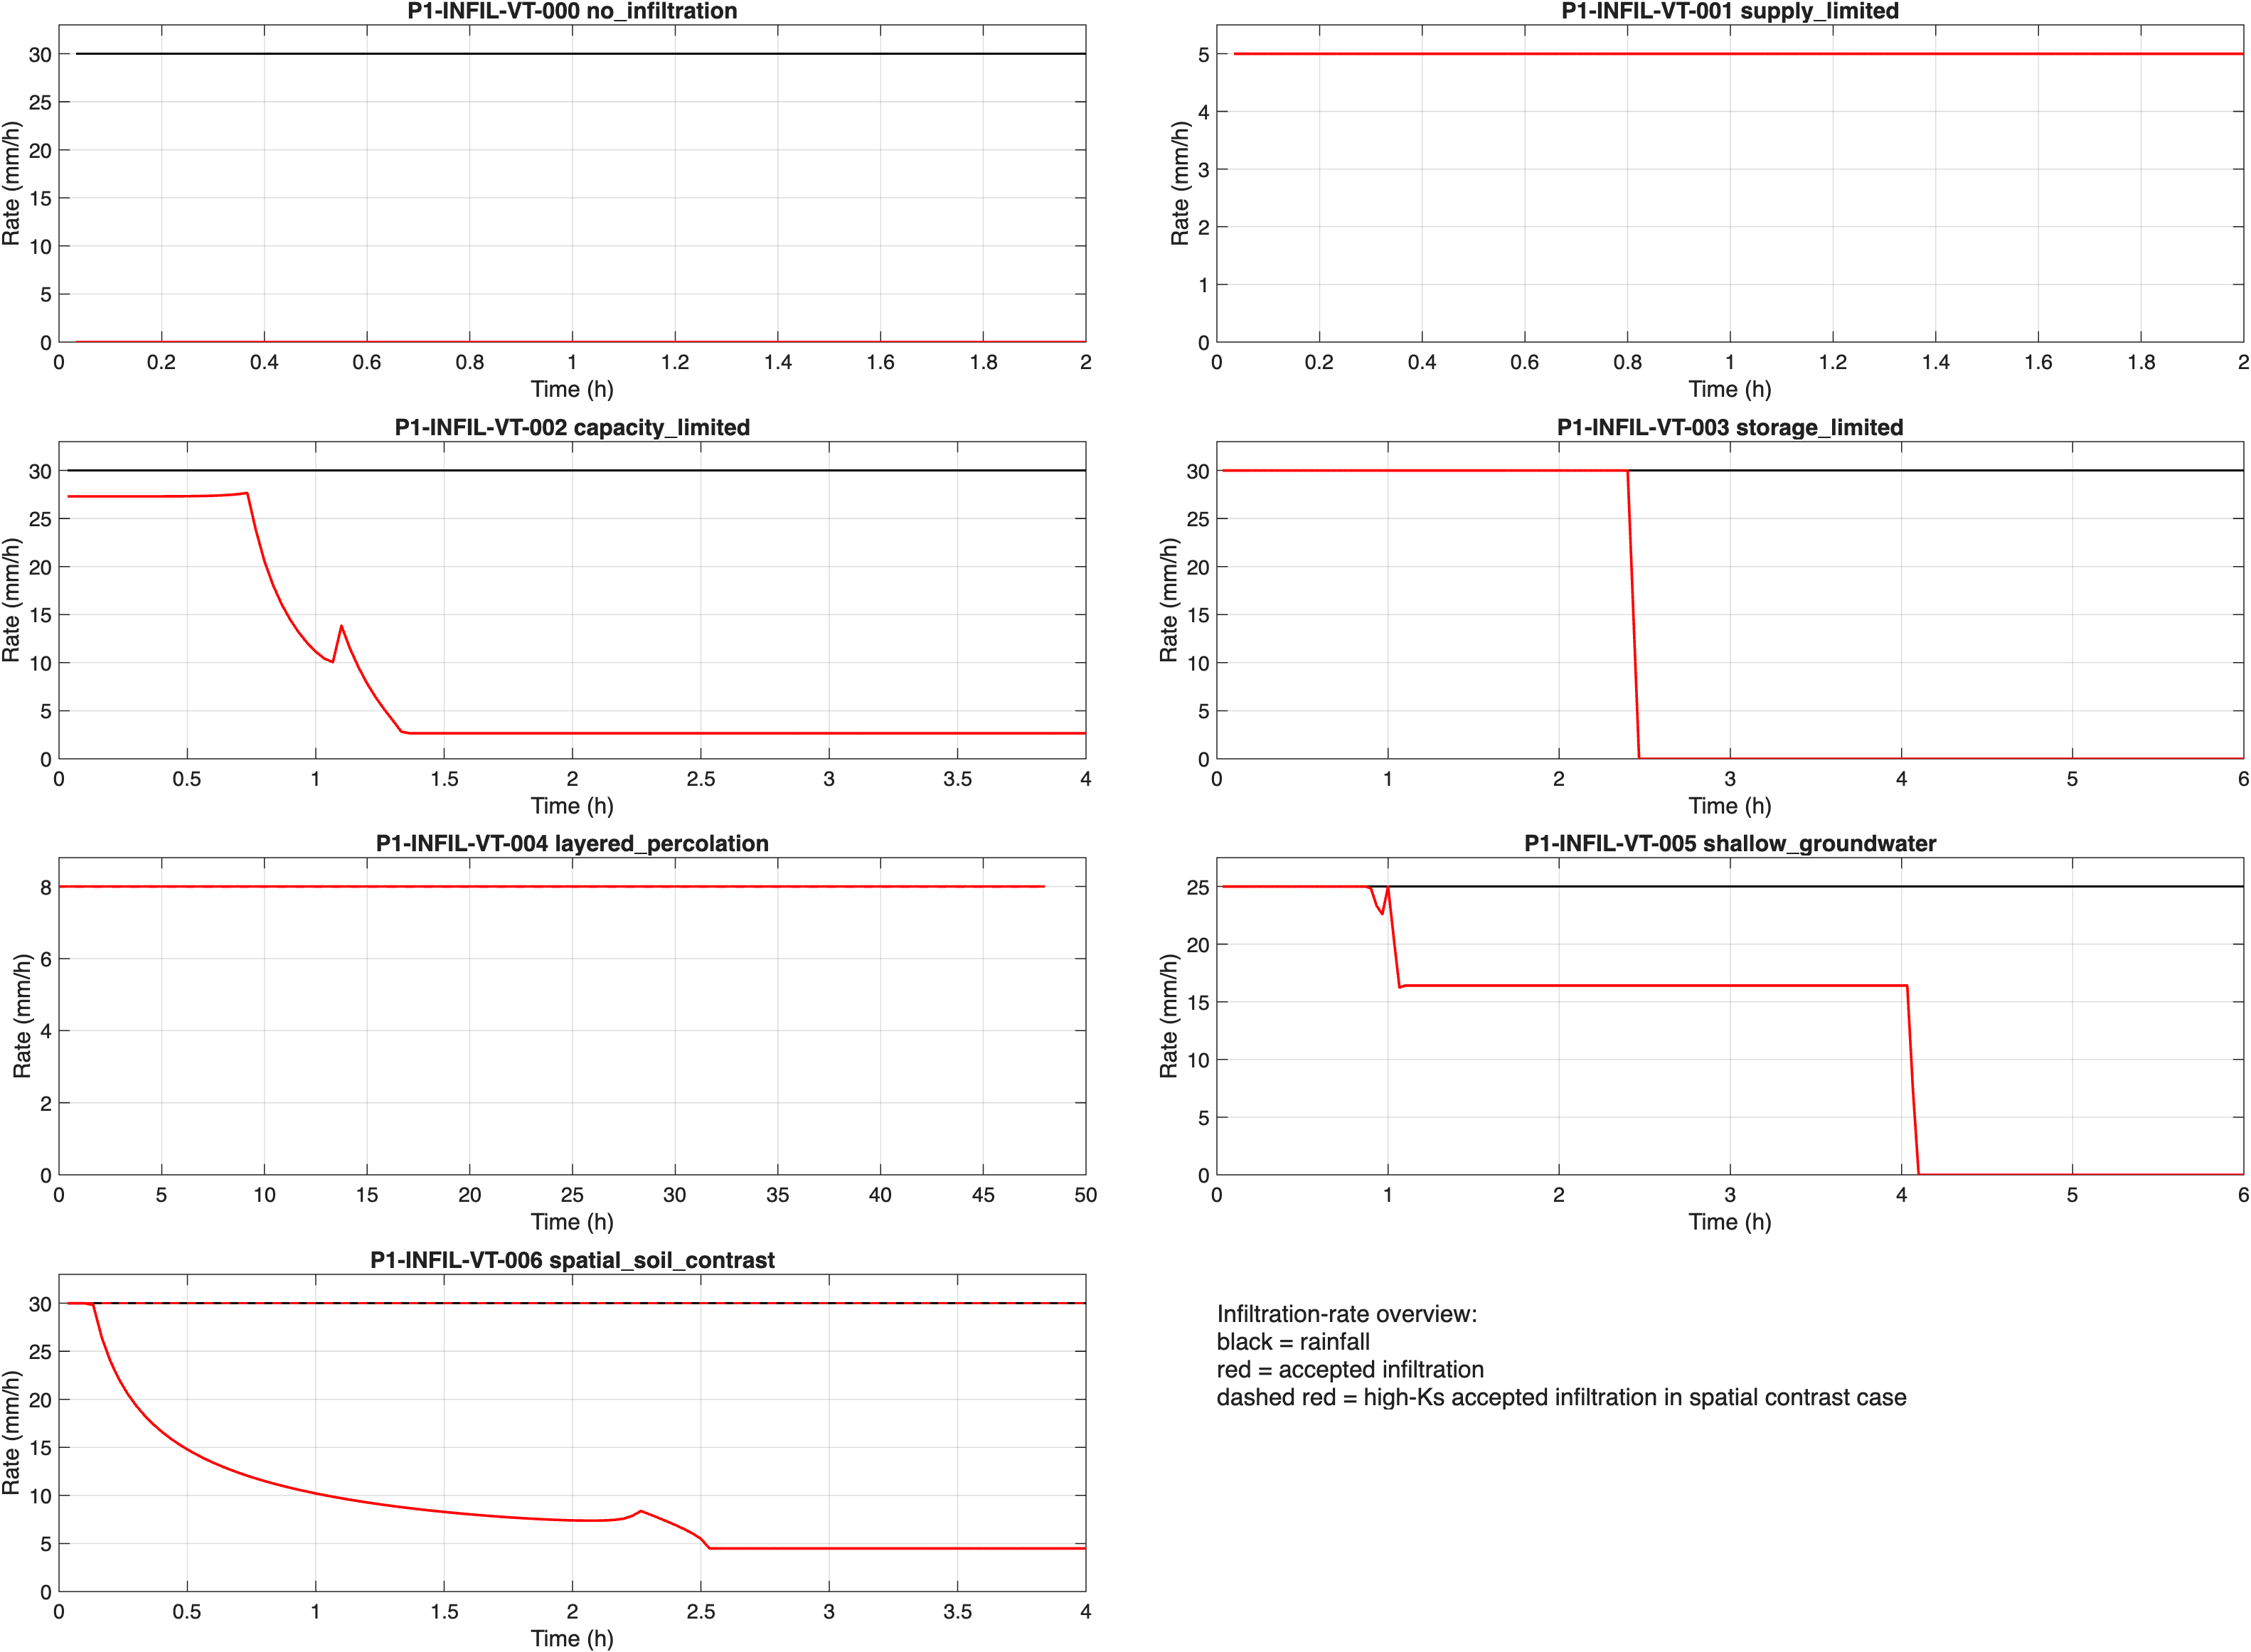
Accepted infiltration rates for the same cases. The figures are reported in mm/h to show how each regime responds through time.
This validates the implemented infiltration bookkeeping and layered-soil dynamics for the tested Phase 1 regimes. It does not validate field infiltration parameters, macropore flow, preferential flow, or a calibrated catchment hydrograph.
Evapotranspiration
What was tested
The evapotranspiration suite uses the V-tilted grid to test both potential ET calculation and actual ET extraction. Seven regimes were tested:
- potential ET formula reproduction;
- open-water storage limitation;
- demand-limited soil extraction;
- storage-limited soil extraction;
- partial near-surface root access;
- internal ETP mode;
- dry, impervious, and invalid-cell masking.
Reference and method
The first case compares HydroPol2D's reference ET calculation against an independent FAO-style Penman-Monteith implementation. The extraction cases compare actual soil ET, open-water evaporation, final storage, masking behavior, and mass residuals against an independent algebraic reference.
Main result
All seven cases passed. The reference ET case produced identical mean potential ET values in HydroPol2D and the independent reference, 5.7669 mm/day. For the extraction cases, HydroPol2D matched soil ET, open-water evaporation, and final storage to machine precision.
| Case | Regime | Mean ETP (mm/day) | Soil ET (mm sum) | Surface E (mm sum) | Residual (m³) |
|---|---|---|---|---|---|
P1-ET-VT-000 | Potential ET formula | 5.7669 | -- | -- | 0.0 |
P1-ET-VT-001 | Open-water limit | -- | 0.0 | 27.0 | -4.44 × 10^-14 |
P1-ET-VT-002 | Soil demand limited | -- | 36.0 | 0.0 | 9.24 × 10^-14 |
P1-ET-VT-003 | Soil storage limited | -- | 27.0 | 0.0 | -4.44 × 10^-14 |
P1-ET-VT-004 | Partial root access | -- | 45.0 | 0.0 | 0.0 |
P1-ET-VT-005 | Internal ETP mode | -- | 18.0 | 12.0 | 3.55 × 10^-15 |
P1-ET-VT-006 | Masks and dry cells | -- | 12.0 | 0.0 | 4.44 × 10^-15 |
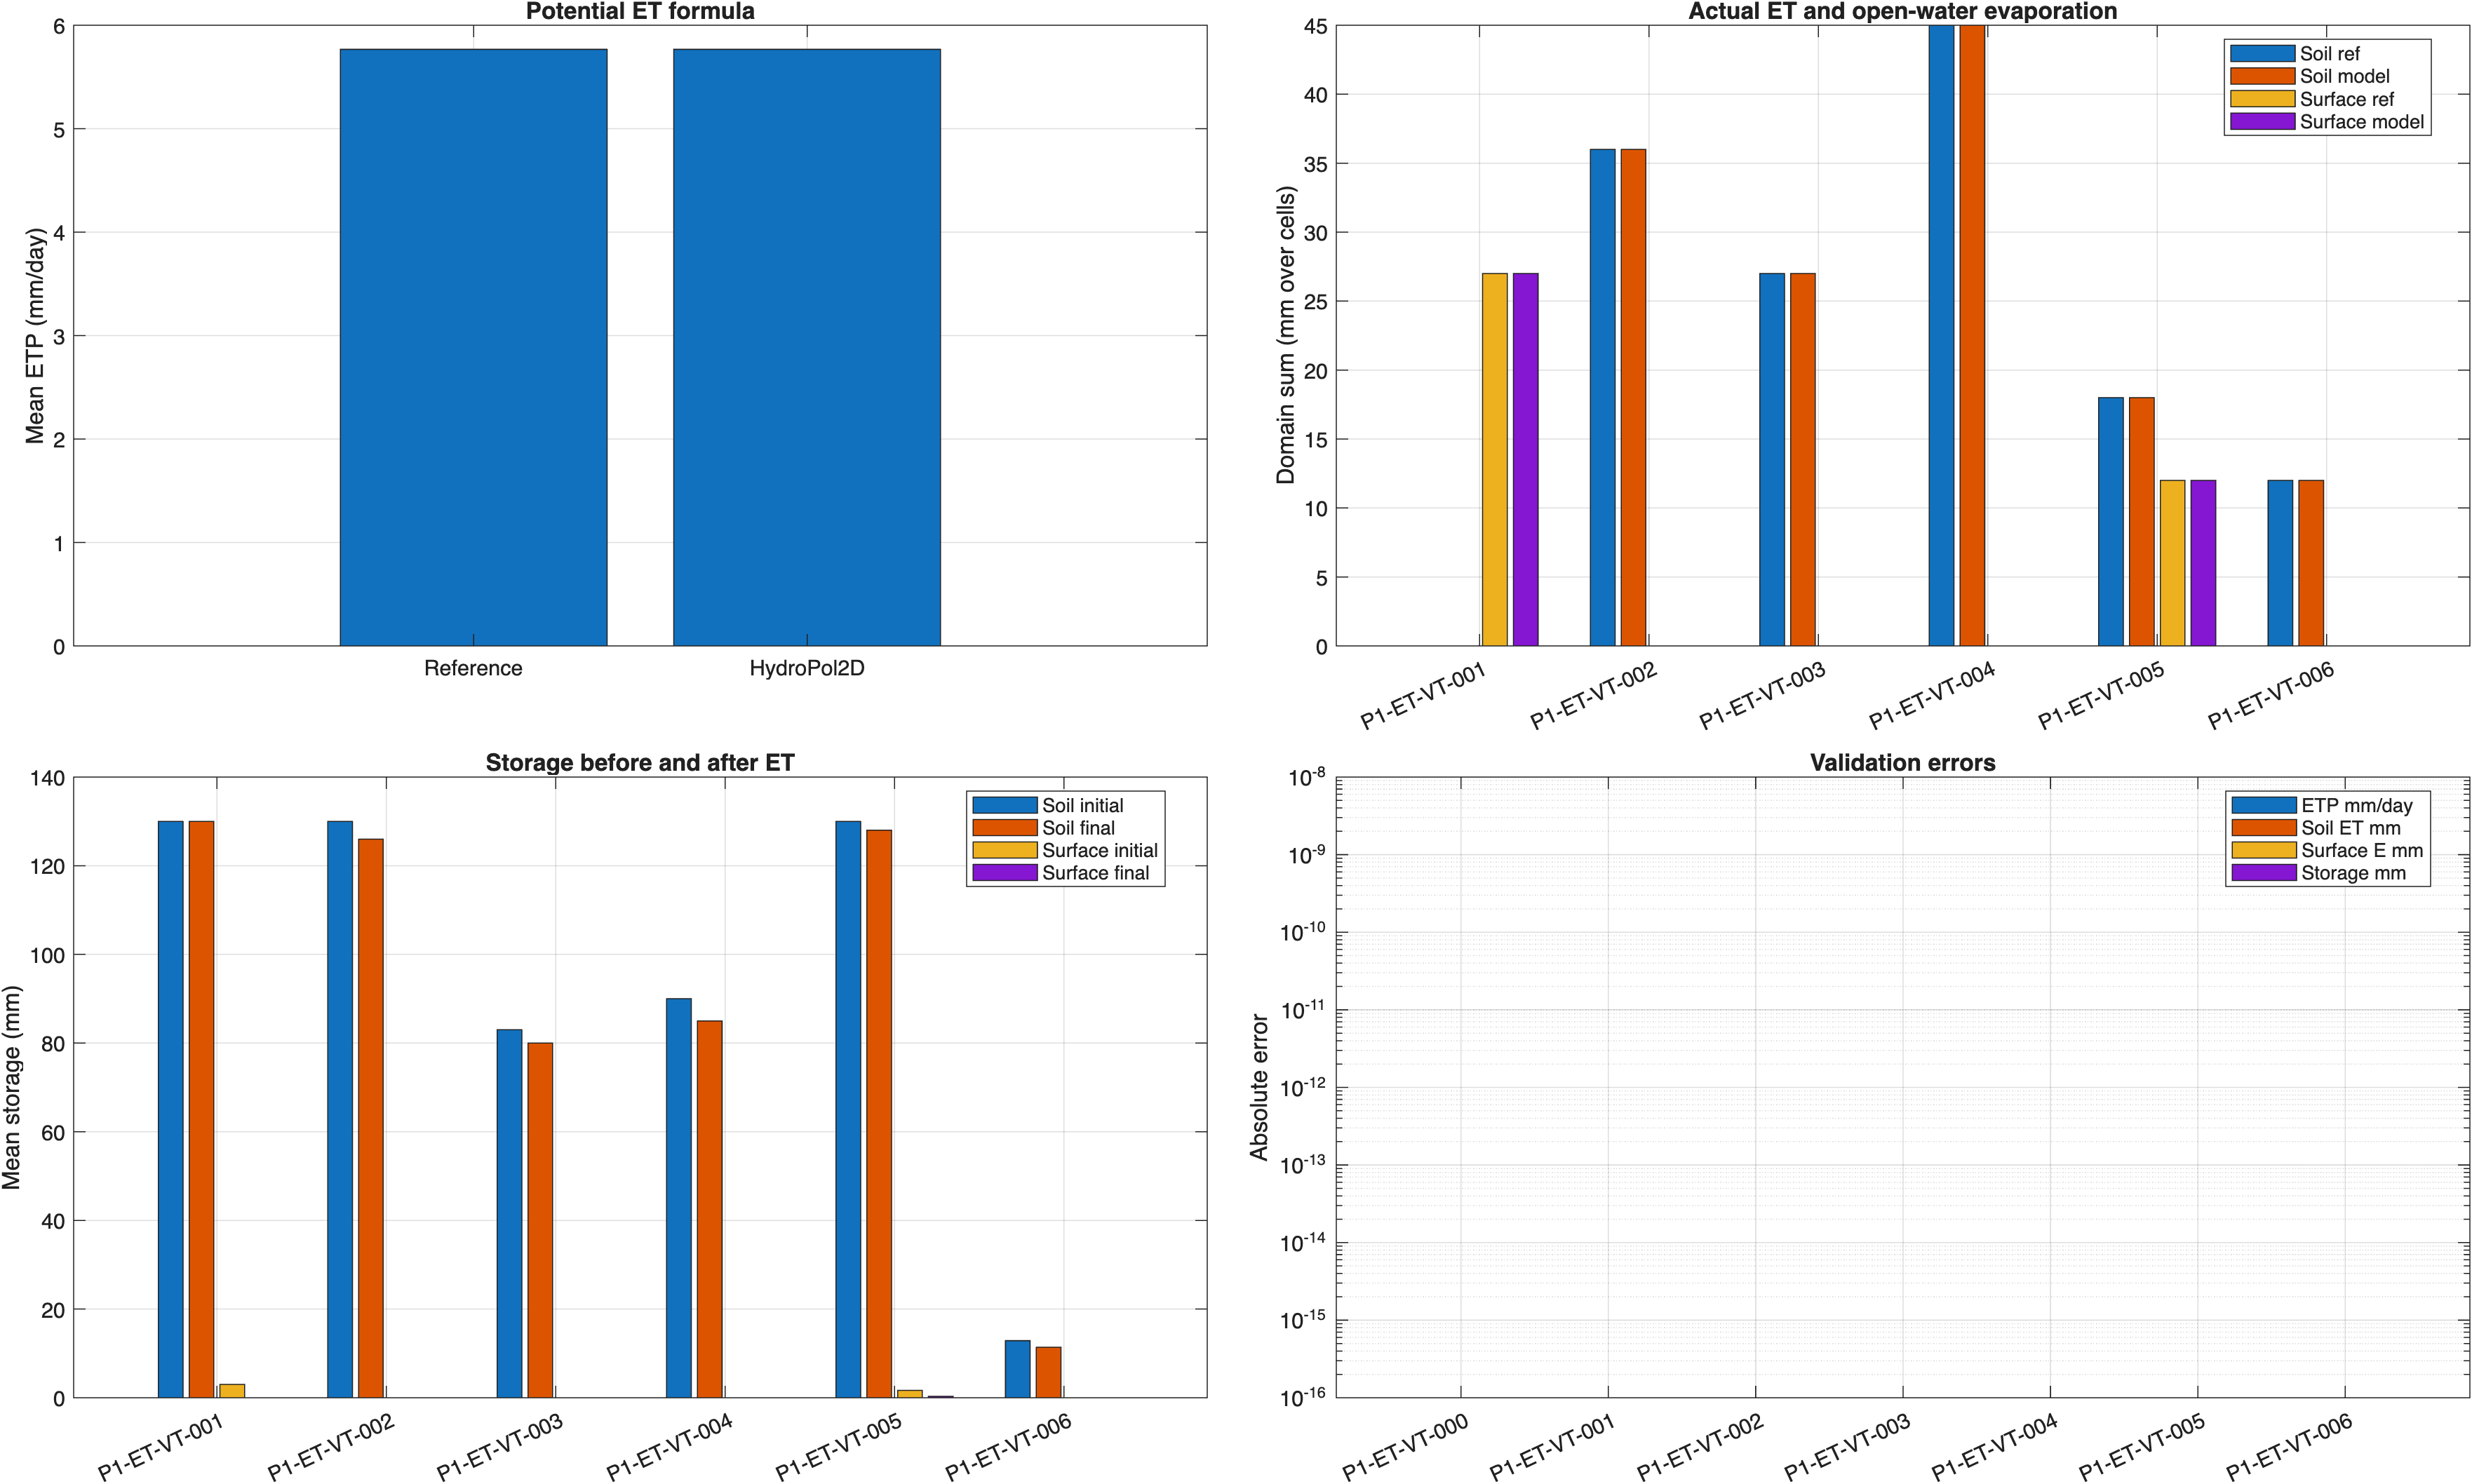
Potential ET, actual soil ET, open-water evaporation, storage before and after ET, and absolute validation errors for the V-tilted ET cases.
These tests validate the implemented ET formula pathway and the actual ET extraction bookkeeping for controlled Phase 1 regimes. They do not validate field-scale ET, crop coefficients, or seasonal water-balance calibration.